

The last blog explored how an investor must approach ratio analysis. In this blog, I will demonstrate this approach using the Debt-to-Equity Ratio. As a quick recap of what we saw in the last blog, an investor should know the following for a ratio:
- Firstly, the type of ratio, which classifies it as a liquidity ratio or solvency ratio, etc.
- Secondly, its description, encompassing all available literature about the ratio, including its purpose, use, limitations, benchmark values, etc.
- Thirdly, the formula to calculate the ratio. It is not just about knowing the formula; the understanding should be to such depth that you need to know about the items that go into the numerator and denominator of the formula.
- Lastly, the interpretation. This is the most crucial part as you need to interpret the ratios to gain meaningful insights, form judgments about the company’s past and future outlook, and make informed decisions.
In this blog, I will use the Debt-Equity ratio as an example and walk through all the above. As I said in the last blog, the ratios are available to everyone. However, only a few can gather insights from these numbers. The key lies in the interpretation of the ratios, which I will discuss in-depth, exploring various possibilities.
(Featured image credits: Photo by RODNAE Productions)
Hi, This is Venkatesh. I write on Personal Finance, Stock Investing, Productivity and Time Management. You will be interested to read more about me and the purpose of my website.
If you are interested in these topics do subscribe to my blogs. You would maximum receive 4 to 5 emails a month. Do check my Blog Index for all my blogs.
DISCLAIMER
The contents of this blog are intended to give an investor an understanding about interpreting Financial Ratio using Debt-to-Equity ratio as an example. These are not to be used by students for academic purposes.
Understanding the Debt-Equity Ratio
Below is the overview of ideas discussed in this blog about debt-to-equity ratio.
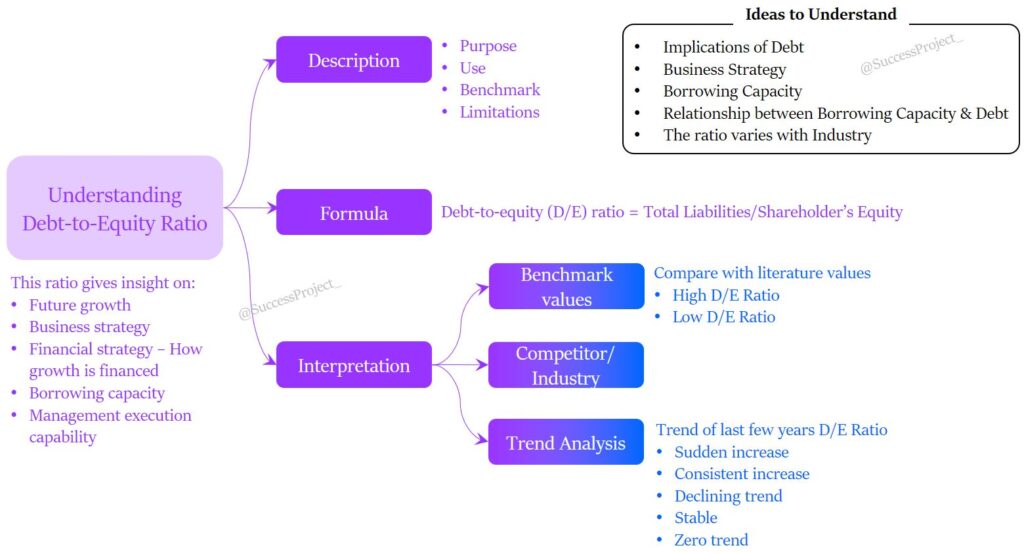
Type of Ratio
- Solvency Ratio
Description of the Ratio
Purpose
This ratio measures how much a company finances its operations through debt versus equity (wholly owned funds). It represents the ratio between internal and external funds or the ratio of owned and borrowed funds.
Use
- This ratio is used to evaluate the solvency of the company.
- Lenders use it primarily for their lending decisions.
- Investors can get a lot of insights on the company’s growth strategy for their investing decisions.
Benchmark Values
- The literature lacks consensus on an ideal or good D/E ratio, with recommendations ranging from 1 to 2.
- A ratio of 2 means the company has two Rupees of debt for every Rupee of equity.
- While this value is acceptable, it indicates a high level of risk.
- Lenders prefer a ratio of 1.
- Lower D/E values are better for the company and its stakeholders.
Note that some companies may have even higher values, like 6 or 8. However, this ratio does not bind any financial institution to lend to the company; lenders may still provide funds if convinced of the safety and security of their investment.
Limitations
- Financial institutions often have a very high D/E ratio due to their business model.
- They borrow money at lower interest rates and then lend it to the public at higher interest rates.
- Therefore, this ratio is not the right measure for evaluating their financial health.
Formula
To calculate the debt-to-equity ratio, one needs information from the balance sheet. It involves dividing a company’s Total liabilities by Shareholder’s equity.
Debt-to-equity (D/E) ratio = Total Liabilities/Shareholder’s Equity
Where, Total Liabilities = Short-term debts, Long-term debts, and Fixed payments obligations.
In some cases, investors only consider long-term debt in the numerator. Long-term liabilities pose higher risks compared to short-term debt and supplier payables.
Not considered as debt are Accrued expenses, Deferred revenues, and Dividends payable.
Related and Important Ideas
You need to understand the below topics to interpret the debt-to-equity ratio in a better manner.
Outcome of Debt
- Debt carries an interest and repayment obligation, with interest paid from the company’s gross profit.
- This mandatory obligation means interest must be paid even if gross profit is insufficient.
- High debt can lead to a catastrophic situation during economic downturns, as interest payments persist despite a lack of revenue, potentially resulting in losses on the P&L statement.
- Debt claims also have higher settlement priority over equity holders.
However, debt is not something to fear. It is a financial strategy used by managements to fuel growth ambitions and improve equity returns. One key benefit is the leverage effect, where debt can enhance Return on Equity (RoE) by enabling higher earnings than without financing. Properly managed debt can be a valuable tool for companies seeking growth and profitability.
Business Strategy
- Management with a growth mindset identifies a profitable opportunity for growth.
- This growth requires investment, and the financial strategy in the hands of management is to use internal accruals and cash generation.
- However, for most companies, this may not be sufficient, and they opt for debt.
- Usually, it is a mix of debt and internal cash (at times may include equity as well).
- The company executes the investment, which would take a few months to years.
- Once the new opportunity starts operations, the company uses increased cash generation to repay the debt.
So, the Business strategy = Identify a profitable opportunity + Financial strategy to fund the opportunity + Execution of opportunity + Repaying strategy (in case of debt)
Borrowing Capacity
- The borrowing capacity of a company, akin to credit card limits, is determined by its Debt-to-Equity ratio.
- This ratio provides insights into the future borrowing capacity of the firm, indicating the extent to which the borrowing limit is already utilized and how much remains available for borrowing from external sources.
- A high D/E ratio implies a fully utilized limit with limited future borrowing scope,
- While a low ratio suggests a partly utilized limit with a favourable future borrowing outlook.
For example, consider a company with 20 million in equity:
- D/E = 0 indicates no debt, with lenders comfortable lending up to 40 million (D/E = 2).
- D/E = 2 means the company has already taken a 40 million debt, and lenders may not be comfortable lending any further.
- D/E = 1 represents an intermediate range, where the company has a debt of 20 million, and lenders are comfortable lending an additional 20 million, taking the D/E to 2.
At D/E of 2 signifies minimal borrowing capacity, while a D/E of 0 indicates high borrowing capacity. Intermediate D/E values reflect varying borrowing capacities.
How Lenders use this Ratio
However, lenders do not rely solely on the D/E ratio for lending decisions. They consider other factors like profitability and cash generation capacity of the company, as insufficient profits may hinder meeting interest obligations. Similarly, investors should not base their decisions solely on this ratio but consider a comprehensive set of ratios, analyze them, gather inferences, and then make an informed decision.
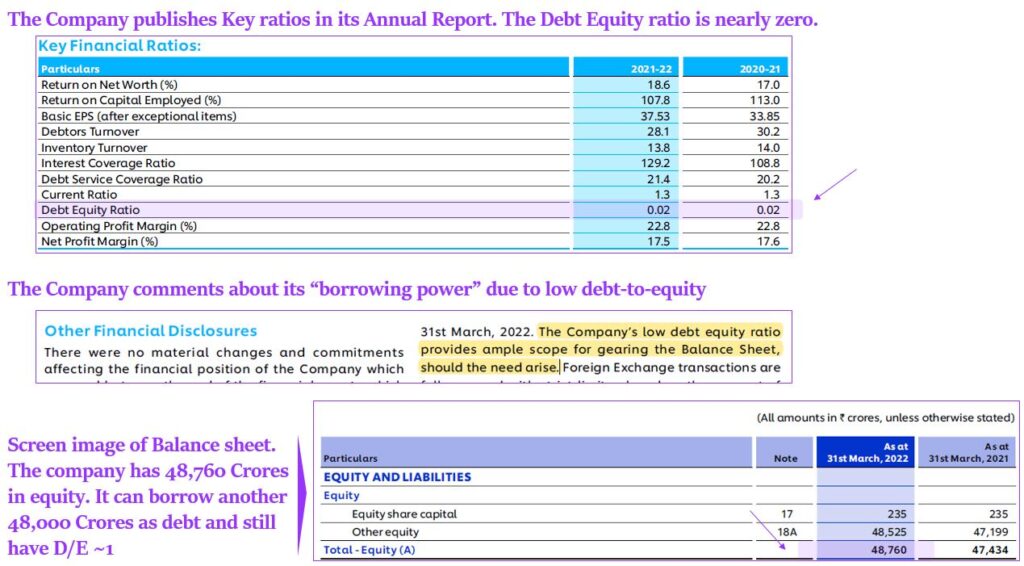
Note: The company’s borrowing power is mentioned in the annual report, along with other relevant financial information. Below is a sample.
Relation between borrowing capacity and future growth
- Profitable opportunities drive growth in a company, necessitating investment.
- However, many companies lack readily available funds and must resort to borrowing from lenders.
- When borrowing capacity is exhausted (D/E > 2), raising further funds becomes challenging, limiting growth prospects.
- A fully utilized borrowing capacity also hinders future borrowing, impeding growth opportunities.
Hence, a strong correlation exists between borrowing capacity and future growth. Without adequate borrowing capacity, a company finds it difficult to pursue further growth. To ensure continued expansion, companies must manage their borrowing capacity wisely to access the necessary funds for growth initiatives.
The D/E varies with the industry
- Different industries exhibit varying capital needs and growth rates, resulting in diverse D/E ratios. A relatively high D/E ratio may be common in one industry, while a relatively low D/E ratio may be prevalent in another.
- For example, a service industry like IT may require minimal capital for growth, while a power generation company necessitates substantial capital to establish new power plants.
Understanding the industry dynamics is crucial when analyzing the D/E ratio. Making accurate inferences requires awareness of industry-specific factors. For instance, finance companies typically have higher D/E ratios, which might be perceived as risky without industry context. Being informed about the industry helps investors interpret financials accurately and make well-informed decisions.
Interpretation of Debt-to-Equity Ratio
Analysis of this ratio gives many insights about
- Future growth of the company
- Business strategy for growth
- Financial strategy to support the business strategy How growth is financed
- Borrowing capacity
- Management execution capability
- Risk of bankruptcy
- External view of the company and much more.
We will see how to gather these inferences from this ratio.
Comparison with benchmarks
Comparing the company’s debt-to-equity ratio with benchmarks from the literature provides valuable insights. As mentioned earlier, the literature suggests an ideal range from 1 to 2. In this discussion, values around 2 are considered high, while values below 1 are considered low.
High Debt-to-Equity ratio
The company’s higher borrowed capital and larger lenders than equity indicate several implications.
- Firstly, it reflects the company’s business strategy of identifying growth opportunities and using debt to fund its ambitions. However, investors must exercise caution as future returns may not meet expectations.
- Secondly, a high debt-to-equity ratio reduces the company’s future borrowing capacity.
- Thirdly, it also raises concerns about the risk of bankruptcy during economic or business turbulence.
- Lastly, a high ratio may be viewed negatively by markets, analysts, and lenders, indicating a weak overall solvency position.
So is this end of the story in case of high debt-to-equity?
There is however one check that an investor must keep in mind. A company may have a high debt-to-equity ratio. But what matters more is repaying capacity of the company. How to evaluate this? Check the cash flow from operations in the cash flow statement. If the cash flow is predictable and the sum of cash flow for the current year and next year is greater than the total debt, then the high level of debt is still safe.
I gained this insight from Mary Buffet’s book “Buffettology.” To illustrate, consider a company with a high debt-to-equity ratio and 100 million in debt. If the cash flow from operations is 60 million, and a similar amount is expected for the next year, the total cash flow would exceed 100 million. Hence, the company’s two-year cash flow is sufficient to repay the debt.
Low Debt-to-Equity ratio
The company relies more on owned capital than borrowed capital. In such cases, the equity of the shareholders surpasses the debt. When there is no external debt, the numerator becomes 0, making the ratio 0. The interpretation is that the entire funding for growth comes from internal sources.
- Business strategy: The company exhibits a conservative approach by not requiring external funds (or borrowing minimally) for growth. This indicates high cash generation and internal accruals to finance growth.
- Borrowing capacity: A zero or low value of this ratio signifies that the company has significant future borrowing capacity to support growth.
- Risk of bankruptcy: Very low. The company is well-equipped to navigate through business crises successfully.
- View about the company: A company with a zero or low debt-to-equity ratio is viewed positively by lenders and investors, as their interests are safeguarded even during business downturns.
Compare with Competitor & Industry Average
The investor compares the debt-to-equity ratio with competitors. If this company stands out with an unusually high or low value compared to its competitors, further analysis is essential to understand the reason behind it.
The same principle applies when comparing the ratio with the industry average.
The evaluation of the ratio should consider the industry context. Companies with capital-intensive operations generally have higher debt-to-equity ratios compared to service-oriented firms.
Trend Analysis
In this method, the investor compares the ratio against the company’s own past values. Calculating the debt-to-equity ratio for the last few years and creating a trend chart reveals possible patterns or trends that the ratio might exhibit.
D/E ratio shows a sudden increase
The inferences are as follows:
- Growth opportunity: The company has identified a new growth opportunity within or outside the industry.
- Business strategy: The company aims to seize the growth opportunity through aggressive funding using debt.
- Management confidence: The management is confident about the growth opportunity, expecting greater future earnings. They believe the company can handle the high debt and repay it from future earnings, reflecting strong execution capabilities.
D/E ratio is increasing consistently
It may indicate potential signs of trouble. However, to get a clear picture, an investor needs to conduct further analysis to determine why the company is increasing its debt every year.
D/E ratio shows the declining trend
- The management is reducing debt, mainly using the cash generated from the new growth opportunity – This can be validated from the cash flow statement.
- Growth opportunity: The company either (1) Has no further growth opportunities, hence not borrowing further and repaying existing debt from the generated cash, OR (2) There are growth opportunities, but the management is conservative. Accordingly, the strategy is to reduce the current debt and stabilize the current growth opportunity before embarking on a new opportunity.
D/E ratio is stable
I have personally not seen such a situation, and it is highly improbable. A consistent D/E ratio indicates that the company has neither reduced nor increased debt.
- Not increasing debt is understandable. However, why did it not decrease debt?
- Does the company not generate sufficient cash flows to reduce its debt? – The cash flow statement has the answer. (or) Is the company reducing debt but taking new debts at lower interest rates?
Further analysis is needed to understand the underlying reasons.
The D/E ratio is Zero (or negligible)
This interesting trend of a D/E ratio ~0 for several years indicates that the company has not borrowed during this period.
- As an investor, you need to check if the company experienced growth in this period, such as increased revenue and profits.
- If there was growth, it suggests that the company made investments for expansion.
- The next question is, how did the company fund this investment without debt?
- There are two possible scenarios: (1) Equity dilution, and/or (2) Internal accruals.
If the growth was funded through internal accruals, then you have more work to do!
- This implies a company with a significant cash-generating capacity.
- To validate this understanding, analyze the cash flow statement for cash generation and CAPEX spending for that period.
- Such a scenario is possible only when the company has a good Return on Investments (RoIC), Return on Equity (RoE), and other indicators of financial health.
- A company with high RoIC, RoE, typically indicates factors like pricing power, a competitive advantage (moat), or less intense competition in the industry.
However, these are only initial pointers, and you must validate them with further analysis of other ratios and industry dynamics.
Summing up Debt-to-Equity Ratio Analysis
In the last case/paragraph, we started with a debt-to-equity ratio, but further investigation led us to explore the cash flow statement for cash generation, Return on Investment ratio, CAPEX, Pricing power, and more. This is the true essence of ratio interpretation. Initially, the ratio may seem like just a number reflecting the relationship between debt and equity. However, with proper interpretation, it unveils a wealth of insights about growth opportunity, management capability, business strategy, external views of market participants, borrowing capacity, and repaying capacity of the firm. Imagine the potential when a set of ratios is analyzed together and interpreted.
Almost every ratio can be the subject of a similar long blog. This sample illustrates the importance of ratio interpretation. As you analyze ratios, take note of your inferences, which will serve as valuable checkpoints for future analysis. The art of ratio analysis lies in the ability to extract meaningful insights from seemingly simple numbers.
Hope you found this blog useful. Do share my blogs with your friends, peers and fellow investors.