

In this blog, I will explore the process of conducting industry analysis by addressing 18 key questions that help investors gain a comprehensive understanding of the industry’s outlook for investment. (Featured image credits: Image by Gerd Altmann from Pixabay)
In the last blog, we discussed the differences and importance of sector and industry analysis. We will see how an investor can perform industry analysis. There are 18 questions, that an investor should seek an answer to. This answer helps to provide a view of the industry’s outlook as being favourite or not for investment.
Investors view industry analysis with a narrow focus on competition in the industry and supply-demand factors. While Porter’s 5 forces analysis is a widely discussed model for industry analysis, it primarily considers competition intensity, suppliers’ and buyers’ bargaining power. However, for investment purposes, industry analysis requires a more in-depth approach. So, let us dive into the depths of industry analysis to understand how it can be conducted.
Before we proceed, I want to emphasize that while reading this blog, you may perceive it as more of an academic exercise. Rest assured, the next blog will provide you with the resources to find answers to all the questions discussed here.
- Components of an Industry Ecosystem
-
Companies
- Q1. How companies in the industry make money?
- Q2. How many companies are there in the industry?
- Q3. How easy it is for a new company to enter the industry?
- Q4. How intense is the competition in the Industry?
- Geographic Distribution of the Companies
- Product Segmentation
- Q5. What %-age of the industry is with organized and unorganized?
- Q6. What is the growth in the industry?
- Q7. What is the level of CAPEX requirements?
- Q8. What are the risks?
-
Products / Services
- Q9. Is the product part of essential or discretionary spend?
- Q10. Is the industry a cyclical or non-cyclical?
- Cyclic Industries
- Non Cyclic Industries
- Other names…
- Q11. What is the %-spend of the customer’s overall expenses?
- Q12. What is frequency of purchase?
- Q13. Does the products have substitutes?
- Customers
- Other Components
Disclaimer
- The industries and companies mentioned throughout this blog are provided solely for the purpose of facilitating understanding and do not represent any investment recommendations such as buying, selling, or holding.
- The ideas presented here stem from my personal learnings and the approach I adopt when conducting industry analysis. It is important to note that these ideas may not align with widely accepted academic models.
- Additionally, the concepts and possibilities discussed herein are of a general nature and may not apply universally, as there can always be exceptions within different industries.
Hi, This is Venkatesh. I write on Personal Finance, Stock Investing, Productivity and Time Management. You will be interested to read more about me and the purpose of my website.
If you are interested in these topics do subscribe to my blogs. You would maximum receive 4 to 5 emails a month. Do check my Blog Index for all my blogs.
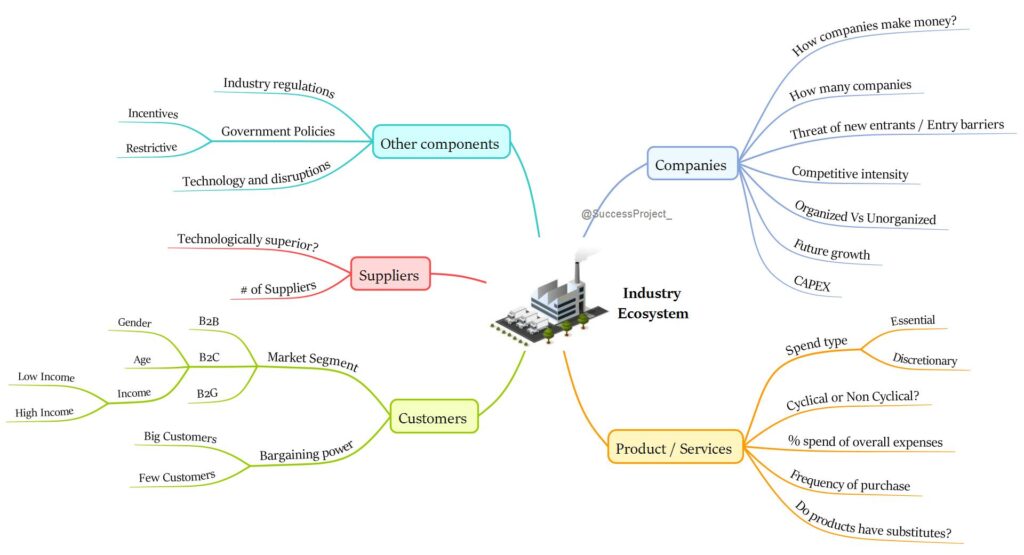
Components of an Industry Ecosystem
The industry analysis often revolves around the companies operating within it, but it is crucial for investors to view the industry ecosystem from a broader perspective. In addition to the companies themselves, the industry ecosystem comprises several key components. These include:
Companies: These are the entities that manufacture products or provide services, forming the core of the industry.
Product/Service: The product or service offered by the industry fulfills the needs or desires of customers. Without this offering, the industry would cease to exist.
Customers: Customers play a vital role as they utilize the product or service to fulfill their needs or desires. They contribute by paying money to purchase the product or service, which generates revenue for the companies operating within the industry.
Suppliers: Companies within the industry rely on suppliers to provide the necessary raw materials required for the production of their products or services.
Other Components: Various other components contribute to the industry ecosystem, including regulatory bodies, government policies, technological advancements, and research for innovation. These elements can significantly impact the future trajectory of the industry.
The components within the industry ecosystem are intricately interconnected, with changes in one component potentially impacting others. Let’s consider a simple scenario where suppliers increase the price of raw materials, leading to two possible outcomes:
- If a company is unable to pass on the price increase to customers due to heavy competition in the industry, its profits will decrease.
(or) - The company manages to pass on the price increase to customers without losing market share, thereby maintaining profitability, but at the expense of customers’ pockets.
Numerous scenarios and potential outcomes exist within the industry ecosystem. It is crucial for investors to have a comprehensive understanding of such outcomes. A holistic industry analysis should focus on the entire ecosystem, recognizing the interplay between various components.
The mind map below provides a visual representation of all the ideas discussed in this blog.
Example from Banking Industry
Let us understand the with a practical example for the Banking industry.
- Companies: Within this industry, individual banks operate as distinct entities.
- Product/Service: Unlike manufacturing industries, banks do not engage in the production of tangible goods. Instead, their core focus lies in providing banking services.
- Suppliers: The primary suppliers in the Banking industry are the depositors who supply funds to the banks through their deposits. Additionally, other suppliers play a role by offering infrastructure facilities and necessary services essential for smooth banking operations.
- Customers: The borrowers seeking financial assistance represent a significant customer segment for banks. They contribute to the bank’s revenue by paying interest on the borrowed funds. However, it is important to note that customers extend beyond borrowers, as there are also individuals and entities interested in availing various banking services, such as opening Savings Accounts or maintaining Salary Accounts.
- Regulations: The Reserve Bank of India (RBI) serves as the principal regulatory authority overseeing the banking industry, ensuring compliance and maintaining the overall stability of the sector.
Companies
This forms the fundamental essence of industry analysis, conducted with the aim of obtaining an investment perspective on the industry. This perspective can either indicate favorability or the lack thereof. If the industry appears favorable, investors proceed to analyze the individual companies within it for potential investment opportunities. By obtaining answers to the following questions, one can gain a comprehensive view of the companies operating within the industry.
Q1. How companies in the industry make money?
In my view, the first and foremost question that should be addressed is understanding how companies within the industry generate revenue. To illustrate this, let’s consider the case of the Banking Industry and examine how banks make money in relation to the industry ecosystem.
- Banks acquire funds by borrowing from depositors through deposits, for which they pay interest to the depositors.
- Subsequently, banks lend this money to borrowers at higher interest rates.
- The profit for the bank is derived from the difference between the interest rates on lending and borrowing.
- In addition to interest income, banks generate revenue through various other services. These can include earning commissions on services like Demand Draft, charging fees for ATM/Debit card usage, collecting fees for loan processing, imposing late fees, penalties, and more.
By understanding the revenue generation mechanisms within the industry, investors gain valuable insights into the financial dynamics and profitability of companies operating within the sector.
Q2. How many companies are there in the industry?
This information provides valuable insights into the structure of the industry, which is determined by the number of companies operating within it. Based on the number of companies, an industry structure can be categorized as follows:
- Monopoly: In a monopoly, only one company exists in the market, resulting in a lack of competition. Such a company has the ability to set prices at its discretion. However, monopolies are relatively rare as government intervention is likely to occur due to concerns regarding pricing power and potential harm to customers.
- Duopoly: A duopoly refers to a market structure where only two companies operate in the industry. If these two companies collude in price-fixing, the market can resemble a monopoly, further reducing competition.
- Oligopoly: An oligopoly is characterized by the presence of a few dominant companies that hold a significant market share. The barrier to entry for new businesses in oligopolistic industries is typically high, leading to a smaller number of companies operating within the industry.
What insights does this give?
In general,
- Competition intensity increases with the higher number of companies operating within an industry.
- Customers benefit from a wider range of product choices offered by numerous companies.
- When there is no product differentiation and price becomes the primary deciding factor, customers tend to opt for the lower-priced product.
- Companies engage in aggressive pricing strategies to retain customers, resulting in intense price competition.
- This industry structure favours customers but leads to lower profitability for companies within the industry.
Consequently, such an industry may appear less attractive to investors.
Conversely, the inverse holds true when there are fewer companies operating within an industry.
It is important to note that this is not an absolute rule, and exceptions do exist. Therefore, investors should refrain from drawing conclusions solely based on this aspect. Instead, they should adopt a comprehensive, 360-degree view of the industry, considering all other components and factors that contribute to its dynamics.
Q3. How easy it is for a new company to enter the industry?
This question serves as an extension of the previous discussion and aligns with the concept of “Threat of new entrants” from Porter’s 5 forces analysis.
- As previously established, a high number of companies in an industry leads to intense competition.
- However, when a new entrant emerges, the competitive intensity escalates further.
- In order to gain market share, the new company typically adopts a strategy of offering lower prices.
- If price becomes the primary determining factor for customers, they are likely to shift their preference towards the product offered by the new company.
- This puts pricing pressure on the existing companies within the industry, ultimately impacting the overall profitability of the industry.
Industries, where new companies can easily enter, are generally considered less attractive for investment. The ease of entry implies that the industry lacks significant barriers, making it more susceptible to increased competition and potential challenges to profitability.
What makes it difficult for a new company to enter?
The term “entry barrier” is significant in assessing the ease with which new companies can enter an industry. High entry barriers make it difficult for new entrants to establish themselves. These barriers can take various forms, such as capital requirements, government regulations, limited access to necessary raw materials, patented technology, and more. Let’s examine a few practical cases to illustrate this concept:
- Is it possible for someone to open a new bank tomorrow? It is not easy, as obtaining a government license is a prerequisite that is not easily attainable.
- Can a new cigarette manufacturer enter the industry? It is not possible, as government policies typically restrict the entry of new companies into this industry.
- Now, consider the diagnostics industry. Can someone open a new laboratory tomorrow? Yes, it is relatively easy if they have the required capital. The healthcare segment is in high demand, and if any approvals are needed, they can be obtained relatively easily.
These examples show that the presence of entry barriers significantly impacts the potential for new companies to enter a specific industry. Industries with high entry barriers tend to be less susceptible to new competition, making them more attractive for investment. Conversely, industries with low entry barriers are prone to increased competition and may pose challenges to profitability.
Q4. How intense is the competition in the Industry?
This aspect is closely intertwined with the number of companies in the industry, as discussed in the previous question (Q1). We observed that the level of competition can vary, leading to varying degrees of pricing power among companies, ultimately influencing overall profitability. In industries with high competition intensity, the pricing power of individual companies tends to be limited, making the industry less appealing for investment.
It is important to note that if a company possesses a unique product differentiation that provides significant benefits to customers, it may possess pricing power, which can enhance its competitive position.
When analyzing competition within an industry, there are a few other factors to consider:
Geographic Distribution of the Companies
Another factor to consider when analyzing competition within an industry is how companies address different geographic segments. If, for example, there are 10 regions and 10 companies, and each company supplies all 10 regions, the level of competition would be intense. In this scenario, each company is vying for market share in every region, leading to heightened competition.
However, in an extreme scenario where each of the 10 companies exclusively serves one particular region, the competition intensity would be significantly lower. In this case, each company focuses on its specific region, reducing direct competition among them.
Understanding the geographic distribution strategies of companies within the industry provides valuable insights into the competitive dynamics and market positioning of each player.
Product Segmentation
The number of companies operating within the same product segment is another factor to consider when assessing competition intensity. If companies operate in different product segments, the competition intensity tends to be lower. Let’s consider the example of the cigarette industry, which consists of two companies:
- Company A manufactures high-cost cigarettes targeting the high-income segment.
- Company B produces low-cost cigarettes targeting the low-income segment.
While both companies are in the cigarette business, their target customers come from different income groups. As a result, there is less direct competition between these two companies, as they cater to distinct customer segments with differing preferences and purchasing power.
By analyzing the level of competition within the same product segment, investors can gain insights into the competitive landscape. Industries with multiple companies targeting the same product segment often exhibit higher competition intensity, while industries with companies operating in different product segments experience lower direct competition among them.
Q5. What %-age of the industry is with organized and unorganized?
This aspect addresses the distribution of revenue between organized and unorganized players within an industry. Organized players refer to listed companies and those operating within the formal economy, while unorganized players typically comprise smaller, informal businesses. In some industries, a significant portion of the market share is held by unorganized players, with a smaller share belonging to organized players. Several notable examples exemplify this dynamic:
- Jewelry Market: The jewelry market is predominantly dominated by the unorganized segment, with Tanishq being one of the few organized players. Over the past two decades, Tanishq has gradually captured market share from unorganized players and is expected to continue doing so.
- Diagnostics Industry: Approximately 85% of the diagnostics industry is unorganized, while the remaining 15% consists of organized players. This presents substantial growth opportunities for organized players in the future.
- Gold Mortgage Lending: A few decades ago, the gold mortgage lending industry was primarily dominated by unorganized players, such as pawnbrokers. However, with the entry of banks and the emergence of listed players like Manappuram and Muthoot Finance, the landscape has transformed, although organized players are still not prevalent on a large scale.
In such industries, there is a significant value migration occurring, with businesses gradually shifting from unorganized players to organized players over time. This presents substantial growth opportunities for organized players, as they compete with unorganized players for market share. As a result, the real competition lies between organized and unorganized players, as the industry landscape continues to evolve.
Q6. What is the growth in the industry?
- The success of equity investing hinges on the growth of earnings within the invested company.
- However, this growth is influenced by various factors, with the overall industry growth being a crucial determinant.
- Certain industries exhibit a long runway with sustained growth potential over many years, while others experience stagnation in their growth trajectory.
- Assessing industry growth becomes a pivotal decision point when evaluating the attractiveness of an industry for investment.
Identifying future growth prospects within an industry is both an art and a skill. In the next blog, we will delve into the sources from which one can obtain valuable information regarding industry growth.
Q7. What is the level of CAPEX requirements?
An industry characterized by strong growth requires significant investment in various assets such as land, machinery, buildings, computers, and software. However, it’s important to note that industries can vary in their capital requirements, with some being capital intensive while others are asset-light. Capital intensive industries tend to consume substantial amounts of cash, while asset-light industries generate substantial cash flows with minimal reinvestment needs. As a result, capital intensive industries are generally considered less attractive for investment, whereas asset-light industries are often viewed as lucrative cash cows due to their ability to generate significant cash flows.
Q8. What are the risks?
This is to identify the different risks to the companies in the industry. Understanding these risks gives an overview of the risks of investing in these companies.
Products / Services
Q9. Is the product part of essential or discretionary spend?
There are two categories of customer spending. Each has distinct characteristics. The distinction between essential spending and discretionary spending provides valuable insights into customer behavior and industry dynamics.
- Essential spend: They are spending on products used in our daily life. The essential spending takes precedence over discretionary spending. Customers prioritize fulfilling their basic needs and expenses related to daily life, such as food, travel, rent, medical expenses, and utilities. Without essential spending, life becomes difficult or even impossible.
- Discretionary spend: This refers to the portion of income remaining after essential spending, which can be allocated towards savings or non-essential purchases and experiences. Examples of discretionary spending include gym memberships, vacations, dining out, luxury electronics, and more. Life is possible even without such spending.
What does this data point indicate?
This data point signifies that industries catering to discretionary products and services experience growth during times of rising income. As customers’ financial situations improve, they are more inclined to allocate funds towards discretionary spending, driving growth in these industries. Conversely, during economic downturns or periods of reduced income, customers tend to postpone or cut back on discretionary spending, affecting the growth of such industries.
This grouping of customer spending helps to answer the next question.
Q10. Is the industry a cyclical or non-cyclical?
This answers how closely an industry’s performance and the share price of the companies in the industry are linked to economic cycles.
Cyclic Industries
- Cyclical industries demonstrate a direct correlation with the overall economy, as they closely follow economic trends.
- When the economy experiences growth, these industries tend to perform well, leading to an increase in stock prices of companies within the industry.
- Conversely, during economic downturns, these industries face challenges, causing stock prices of companies to decline.
- Consequently, the stock prices of companies in cyclical industries exhibit volatility and remain closely linked to the economic cycle, which typically consists of expansion, peak, recession, and recovery phases.
Notably, the products and services offered by these industries are often part of discretionary spending. When economic conditions become challenging, individuals tend to curtail their discretionary spending first. Even with the anticipation of tough times ahead, consumer consumption is affected, thereby impacting the revenue of companies operating within these industries. As a result, cyclical industries are particularly susceptible to fluctuations in consumer behavior and economic conditions.
Non Cyclic Industries
- Non-cyclical industries are known for their profitability irrespective of economic trends.
- In fact, they may even outperform the overall market during periods of economic slowdown.
- This resilience stems from the fact that these industries produce goods and services that are essential for daily life, such as food, utilities, and household goods.
- Utilities, encompassing power, water, cooking gas, and fuel, are vital necessities for everyday living.
- Additionally, household goods like toothpaste, soap, shampoo, and dish detergent, while they may initially appear as non-essentials, play crucial roles in maintaining personal hygiene and cleanliness. The importance of these goods is such that individuals cannot afford to go even a day without showering or brushing their teeth.
- Given the indispensable nature of their products and services, non-cyclical industries tend to exhibit stability and lesser volatility in their stock prices.
- They consistently perform well across economic cycles, making them attractive investment options, particularly when the economic outlook appears unfavorable.
Non-cyclical industries, by virtue of providing goods and services that are part of essential spending and are consistently used, tend to experience conservative and steady growth. Their revenue streams are less susceptible to significant fluctuations, offering investors a sense of stability and predictability.
Other names…
This industry is referred to by other names
- Defensives because they can defend investors against the effects of an economic downturn.
- “All-weather” industries: These are part of the “Essential spends”. Customers need the product irrespective of their economic condition.
Thus you can see one set of industries is affected by broad economic changes and the other is virtually immune to them. This is because the industries link customer spend type.
Q11. What is the %-spend of the customer’s overall expenses?
Allow me to illustrate this concept with an example. Suppose I purchase a mobile phone for INR 15,000, while my annual expenses amount to 5 lakhs. In this case, the percentage spent on the mobile phone is 3% of my total expenses.
Why is such an analysis useful? This analysis enables the identification of products as low, medium, or high-ticket items based on their relative expenditure.
- Let’s consider the example of a low-ticket item like a matchbox.
- A family may require only one matchbox for the entire month, which costs INR 10.
- This amount is relatively negligible when compared to their overall spending, at least for the majority of the population.
- Now, let’s hypothetically increase the price to INR 15, representing a 50% increase.
- How would this impact consumption patterns? The effect would be almost negligible, as the product is a small-ticket item, and an additional INR 5 is unlikely to significantly impact their budget.
Contrastingly, consider a medium-ticket spend on food.
- If the same person is spending INR 10,000 per month on food, even a 10% increase would result in an additional expenditure of INR 1,000.
- This amount could be substantial for many customers.
- While one cannot go without food, individuals might seek alternatives or cheaper products to avoid the extra INR 1,000 expense.
Hence, the ticket size of a product in relation to overall expenditure provides insights into customer preferences, demand, the pricing power of companies, and the consumption patterns within the industry. Analyzing these factors can help investors gain a better understanding of customer behavior and make informed investment decisions.
Q12. What is frequency of purchase?
The frequency of customer purchases plays a significant role in understanding consumer behavior. Essential items like food, for instance, are required on a daily basis. In contrast, other products may be purchased less frequently. For example, a matchbox may only be bought once a month, while a new television may be purchased every 3 to 5 years.
This understanding, combined with the previous aspect of “%-Spend of overall expenses”, provides valuable insights. Referring back to the example of the matchbox, it is a low-ticket item priced at INR 10, with a purchase frequency of once a month. Even with a 50% price hike, the customer’s spending would only increase by INR 5 for that month. When the price of a product and the frequency of purchase are lower, the industry may not experience significant price pressure.
Q13. Does the products have substitutes?
Another crucial consideration derived from Porter’s Five Forces analysis is the availability of cheaper substitutes to fulfill the same need as the industry’s product or service.
Understanding the presence of substitutes is significant because when the price of the industry’s product increases, consumers may opt to switch to these substitutes. This shift in consumer preference can have a detrimental impact on the industry’s profitability. Therefore, an industry that lacks viable substitutes is generally more favourable for investors, as it reduces the risk of significant market share erosion and profit reduction due to consumer switching behaviour.
Industries with a limited number of substitutes enjoy a more secure market position and may offer greater investment potential.
Customers
Customers are the market for the products produced by the industry. They pay money and buy the product or service from the companies in the industry. Customers bring in revenue and are an important part of the industry’s ecosystem.
Q14. What is the Market Segment?
This analysis provides insights into the target customer base to whom companies sell their products. By understanding the dynamics of customers, including their characteristics and preferences, investors can gain a deeper understanding of their bargaining power and the overall profitability of the industry.
Market Segment
There are three broad market segments based on the target customers to whom companies sell their products.
- The first segment is B2C (Business to Consumer), where companies sell products directly to consumers. This may involve various distribution channels through which the products reach the end-users.
- The second segment is B2B (Business to Business), where products are sold for use by other businesses or companies. For instance, an auto ancillary company may sell its products to larger OEMs (Original Equipment Manufacturers) in the automotive industry.
- The third segment is B2G (Business to Government), where companies sell their products to the government. This can include selling to local agencies, state governments, or even the central government.
In many cases, companies within an industry have a mix of two or all three market segments. It is not limited to a single segment. Let’s take the diagnostics industry as an example.
- In the B2B segment, large hospitals and clinics serve as customers, supplying patient samples to diagnostic labs for testing.
- In the B2C segment, retail customers directly visit diagnostic labs for routine or preventive tests without a doctor’s recommendation.
- In the B2G segment, the government acts as the customer, and diagnostic labs participate in government schemes targeting economically underprivileged populations. Payment for the tests is made by the government.
Which is Better?
Each business model, whether B2C or B2B, has its own unique advantages and disadvantages. In the B2C model, companies typically reach out to consumers through advertising and marketing campaigns, aiming to create awareness and drive direct sales. On the other hand, B2B transactions often involve face-to-face interactions and relationship-building between businesses.
Within each market segment, there can be further sub-segments based on various factors such as age, gender, social class, income level, or lifestyle. Among these sub-segments, the income level sub-segment holds particular importance for investors. Customers can be categorized into low-income and high-income groups, allowing for a more targeted analysis of their purchasing behavior and preferences.
While a detailed explanation of the differences among these market segments is beyond the scope of this blog, having a high-level understanding of the market segmentation is valuable. It helps investors grasp the pricing power of the company, assess the price sensitivity of the customers, and gain insights into the overall market size and potential opportunities for growth.
Q15. What is bargaining power of customers?
According to Porter’s 5 forces analysis, industries become less attractive for investment when customers have higher bargaining power. This means that the industry struggles to generate decent profit margins or profits due to the influence of customers.
When do customers have bargaining power? A few situations,
When the customer is very big
- A classical case is the Auto industry, where the OEM (Original Equipment Manufacturers: Car/2 wheeler manufacturers) are customers of the auto ancillary industry.
- As the OEMs are much bigger in size, they have the ability to put pressure on the cost of supplies and raw materials from auto ancillary companies, aiming to reduce the overall cost of their vehicles.
When there are very few customers
- To better explain this consider a hypothetical company that has only one customer. The company is completely dependent on its single customer.
- If the customer decides to stop buying, the company would experience a complete loss of revenue.
- Aware of this vulnerability, the customer can negotiate prices with the company, leveraging their bargaining power.
- On the contrary, when a company has a large customer base, the loss of a single customer would have minimal impact on its overall revenue, thereby reducing the bargaining power of individual customers.
An industry where the customers have high bargaining power is lesser attractive for investors.
Suppliers
They provide the raw material needed for the product (or service) in an industry. In some industries, the raw material costs a big part of the total cost of the product. In such cases, the final cost of the product and profit of the company is very much sensitive to changes in the price of raw materials. Understanding the dynamics of suppliers on their pricing power (Also called Bargaining power in Porters’ 5 forces analysis) gives an idea of the profitability of the industry.
How to understand or analyse the pricing power of suppliers in the industry? The answer lies in two questions.
Q16. How many suppliers are there?
This determines the pricing and bargaining power of the suppliers.
- If many suppliers exist in the industry, each competing for business, it reduces their individual bargaining power. This gives companies in the industry more leverage in negotiating favorable prices and terms.
- Conversely, if only a few dominant suppliers control the market, they possess more pricing power. They can dictate terms and increase prices, putting pressure on the profitability of companies in the industry.
- The profits of the companies in the industry erode, if:
- Price of raw materials is increased and if
- The company is not able to pass this price rise to its end customers (without affecting the market share)
Cigarette companies buy from a large number of tobacco farmers. The suppliers do not have high bargaining power. Thus, the Cigarette manufacturers have lower costs and enjoy better margins.
Q17. Is the product from a supplier technologically superior?
If the supplier provides a unique product which is technologically superior and cannot be easily replicated by another supplier, then the supplier has higher pricing and bargaining power.
An industry where suppliers have high bargaining power is less attractive as it impacts the profitability of the companies in the industry.
Other Components
Q18. How are the regulations, government policies and Technology in the industry?
Industry regulations
Regulations can kill or flourish an industry. Regulators have a huge influence and control over the functioning of the industry. You need to understand if the industry is highly or loosely regulated. Consider a few cases.
- Banking industry. The Reserve Bank of India (RBI) closely monitors and regulates the banking sector.
- Tobacco industry. The companies cannot advertise the products. The products need to be sold only to people of a certain age group.
Government policies
- Government could come up with some policies or incentives to benefit the industry.
- It could also involve price control. In the case of the Diagnostics industry, the Government in the past had put a slab on the price of tests.
Technology and Disruptions:
What is the latest trend in the industry that could disrupt the industry? Is the industry geared to absorb new technology and disruptions?
Conclusion
Conducting a thorough industry analysis is vital for investors seeking to make informed investment decisions. By addressing the 18 questions outlined in this blog, investors gain valuable insights into various aspects of the industry, including its structure, competition, customer dynamics, product substitutes, bargaining power of customers and suppliers, market segments, regulations, and more.
We are towards the end of this blog. If you are with me till now, you feel that these aspects are highly academic. How could an investor answers these questions? What are the methods and sources to get answers to these questions? We will see in the next blog that all this information is only a few clicks away.
Pingback: 10 easy sources of Data for Industry Analysis - Venkatesh
Pingback: Is Sector and Industry Analysis Important?
Pingback: Dividends analysis is important for investment - Venkatesh