
Are you a long-term investor in the stock markets who makes your own stock picks? Then this blog on the analysis of a 10 year financial summary will be very much useful to you.
(Featured image credits: Photo by Artem Podrez)
As an investor, you identify stock names through a screener or one of your friends. You then deep dive to understand more about the company’s performance, business model, management integrity, and many other factors before making a decision on investing. Such an analysis goes for days or even weeks.
At times, you find that the stock is not worth investing in and stop further analysis. Analyzing a 10-year financial summary is an intermediate step that helps you decide if you should deep dive further.
Hi, This is Venkatesh. I write on Personal Finance, Stock Investing, Productivity and Time Management. You will be interested to read more about me and the purpose of my website.
If you are interested in these topics do subscribe to my blogs. You would maximum receive 4 to 5 emails a month. Do check my Blog Index for all my blogs.
You might also be interested to read these related articles:
What is a 10-year financial summary?
- The financial statement serves as a window to the company’s financial performance and consists of three main statements: the Balance sheet, the Income statement, and the cash flow statement.
- A 10-year financial summary compiles the details of these three statements for a decade into a single-page summary.
- By analyzing this comprehensive 10-year financial statement, you can swiftly gain powerful insights into the company.
- After screening your initial ideas, dedicating just 1 to 2 hours to this exercise allows you to extract valuable information.
In this blog, I will delve into the inferences you can gather from the 10-year financial summary, providing detailed explanations along the way.
Where to look for this 10-year financial summary?
Annual Reports
- Most company annual reports present a one-page overview of their 10 years of financial performance.
- New companies with lesser history may provide a 5-year financial statement.
10-Year statements
- Some companies publish this as a separate document and upload it to their website.
- You can find it in the “Investors” section of the annual report.
Screener website
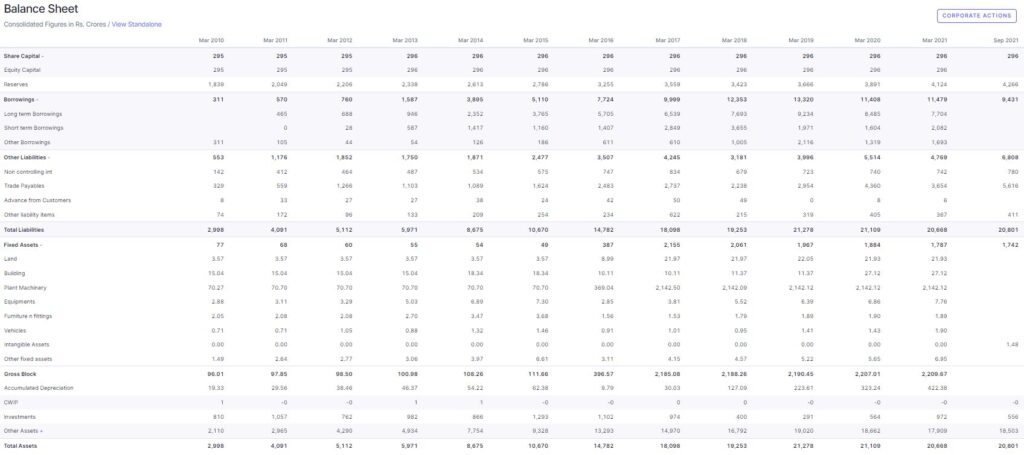
Many financial websites offer a 10-year snap of these financial numbers, and one such good website is screener.in.
Below is the screen image of a company’s 10 year financial summary.
Manual mining
- You pick the numbers from 10-year annual reports and feed them into Excel for further analysis or gathering insights.
- Undoubtedly, this option consumes a significant amount of time.
- However, it becomes necessary only in situations where you are looking for a certain number or ratio that is not covered in the published statements.
- For instance, you may want to see the trend of the cash conversion cycle, inventory turnover ratio, RoE, etc.
- On the other hand, for an initial high-level analysis, the published summary from the company is sufficient.
What does this 10-year financial summary contain?
The format of this report is not standardized. Different companies share different information and present it in various formats. In general, this summary includes several sections:
- Firstly, there are financial metrics, which consist of financial numbers from the 10 years’ financial statements. These financial metrics provide only the key details, omitting every line item from a balance sheet, income statement, or cash flow statement.
- Secondly, there are operations metrics, which may encompass operational details such as the number of units produced, the amount of loans given (in the case of banks), the volume of footfalls (in the case of a retail business), and so on.
- Additionally, financial ratios are present in this summary, focusing on measures of profitability, such as EBITA Margin or OPM.
- Moreover, notes are included in the report to capture significant events that occurred in a particular year.
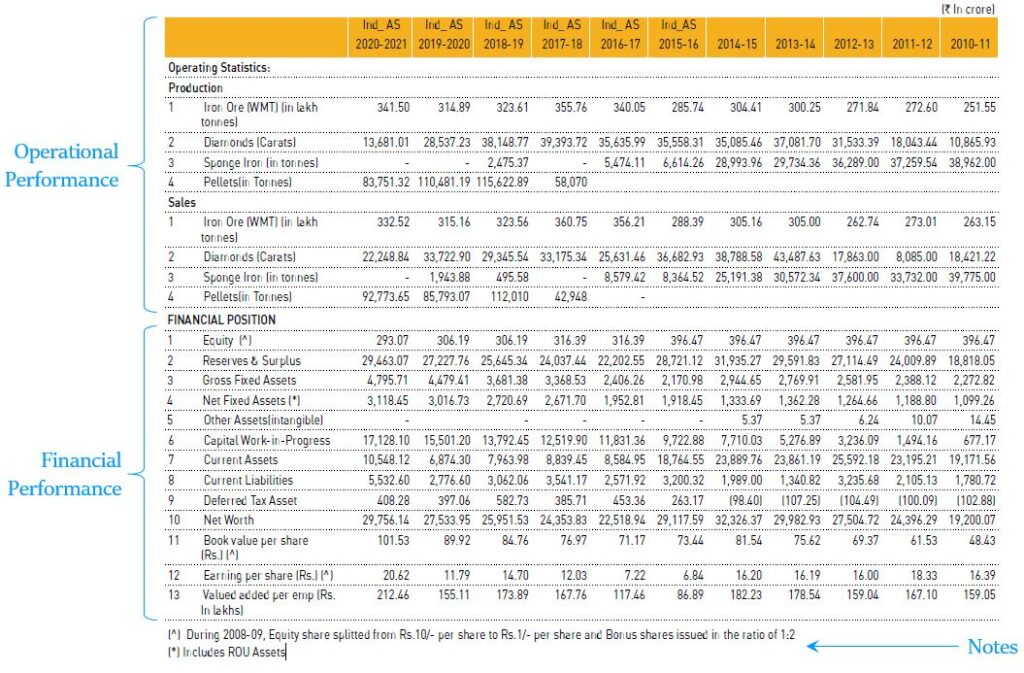
The financial metrics represent the minimum details that all companies share in their 10-year summary. However, some companies also include the operation metrics and financial ratios in their reports. Below is a sample from one such 10-year financial summary.
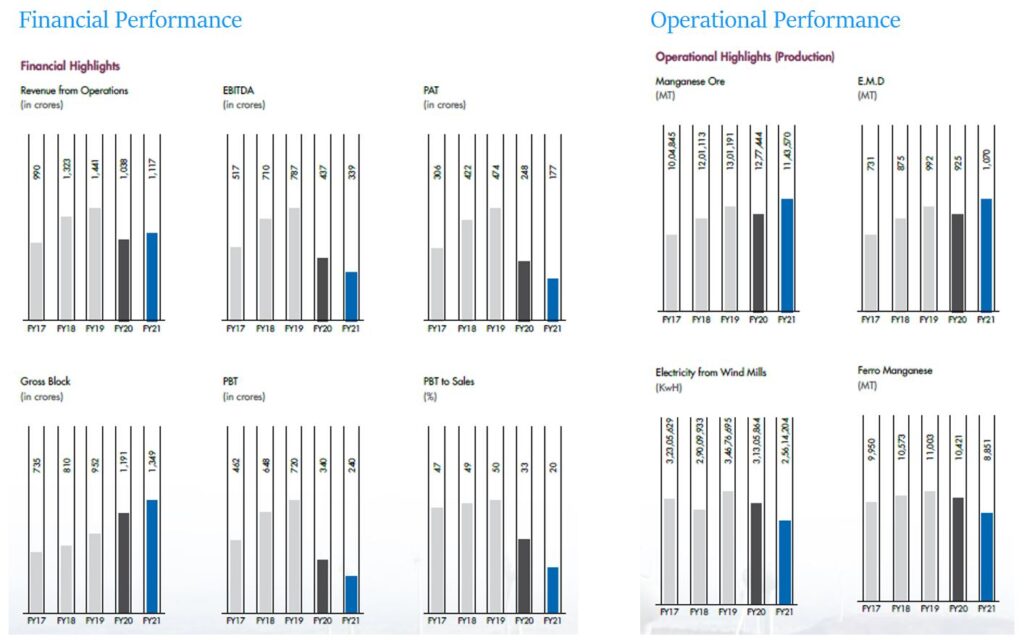
Some companies may share the same information in the form of a chart/graph instead of a table. Below is an example from one such company that has presented both financial and operational metrics in the form of graphs.
What information to see and infer from the 10-year financial summary?
Borrowings
These could be short-term or long-term borrowings. However, long-term borrowing carries higher importance due to its usually significant size and the interest burden it imposes on the company’s earnings.
When there is a decreasing trend in long-term borrowing, it indicates that the company is moving towards becoming debt-free. As a result, there will be a reduction in interest outgo and an increase in earnings for the company.
On the other hand, an increasing trend in borrowing may suggest one of two possibilities: (1) Signs of financial troubles or (2) the company is heavily investing in CAPEX (capital expenditure). An increasing trend of borrowing warrants further scrutiny to identify the underlying reason for the increased borrowing. To determine whether the company is investing in CAPEX, it is essential to validate this inference by checking the CAPEX and growth plans stated in the company’s Annual report. In such cases, you may have to delve deeper into the company’s financial reports to gain a comprehensive understanding.
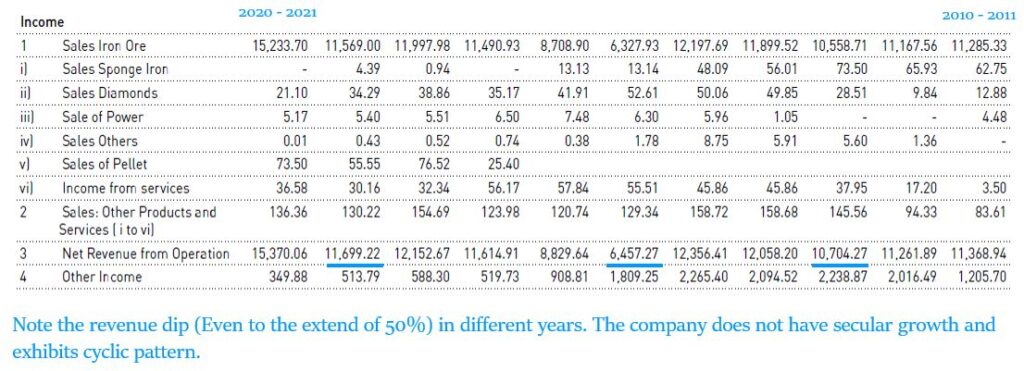
Revenue Growth
CAGR: While it is the most weighted metric when discussing revenue growth, a plain 10-year CAGR can be misleading, as it does not provide a true picture of the company’s performance in the intermediate years.
Revenue Trend: Before calculating CAGR, it is essential to examine the pattern of revenue. Does the revenue show a secular growth or a fluctuating pattern with ups and downs? This revenue trend offers valuable insights into the nature of the industry, whether it exhibits cyclic or secular growth. CAGR holds significance primarily for secular growth companies, where revenue increases consistently every year. This is precisely why it is necessary to assess the revenue trend before calculating CAGR.
Operating Profit Margin
The operating profit margin serves as an indication of how much profit a company generates after covering direct costs, such as wages, raw materials, and other production expenses.
A change in this margin over time provides valuable insights into various aspects:
- The pricing power of the company,
- The impact of rising raw material costs, and
- The intensity of competition within the industry.
When there is a decreasing trend in the margin, it may indicate one of the following scenarios:
- The production costs (wages or raw materials) have increased, but the company is unable to pass these costs on to customers without affecting its revenues.
- The costs could be stable, but the company had to reduce the product price to maintain its market share, likely due to increased competition from new entrants in the industry.
On the other hand, an increasing trend in the margin may indicate:
- The company has successfully reduced production costs, leading to higher profit margins.
- The company possesses strong pricing power, allowing it to increase prices without negatively impacting its revenue. This suggests lower competition in the market and strong brand loyalty for the company’s products.
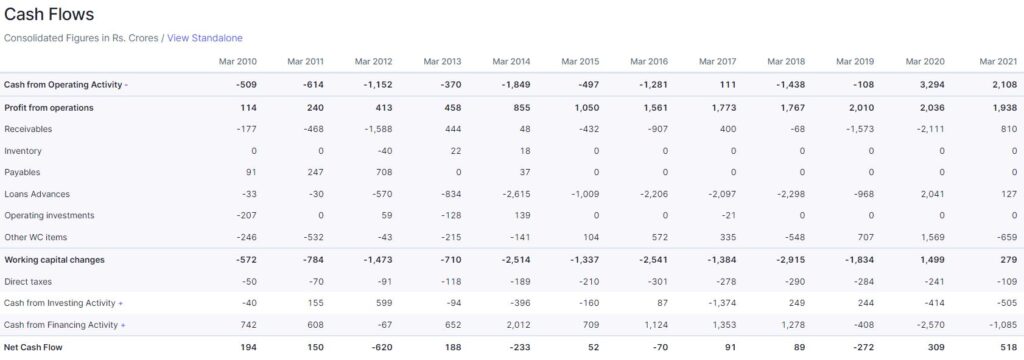
Cash Flow from Operating activities (CFO)
The cash flow from operations represents the amount of cash generated by the company’s core business operations, excluding long-term capital expenses. It stands as the real profit, while the Net Profit in the income statement represents the accounting profit.
To assess the company’s cash flow health, focus on two main pointers:
- Is there a positive CFO (cash flow from operations) in most of the years?
- Compare the 10-year cumulative CFO with the 10-year cumulative Net profits (from the income statement). Ideally, the cumulative CFO should be greater than the cumulative net profits. This serves as strong evidence that the company effectively converts its accounting profit into cash.
Free Cash Flow
Free cash flow is calculated by: Cash flow from Operations – Capex.
- The cumulative 10 years FCF (Free Cash Flow) should be positive, as this indicates that the company manages its CAPEX using CFO (cash flow from operations) and has some remaining funds for shareholders or sales growth.
- To assess the efficiency, calculate the percentage of 10 years cumulative FCF with 10 years cumulative CFO. A lower ratio is considered better, as it signifies that a larger proportion of the cash flow is available as free cash flow.
Please note that many companies do not publish their Cash Flow Statements in their 10-year financial summary. In such cases, the screener website can be a useful tool for obtaining this information. Alternatively, you can manually extract the numbers from the company’s 10-year annual report. Below is a screen image of a 10-year cash flow statement from screener as an example.
Conclusion
Much more analysis is possible with every line item in a 10-year finance summary. This could be dividends, current investment, fixed assets, equity share capital etc.
Analyzing a company’s 10-year financial statement provides invaluable insights into its financial performance and health over an extended period.
- By examining financial metrics, operational details, and financial ratios, one can gauge the company’s growth trajectory, profitability, and operational efficiency.
- Additionally, trends in long-term borrowing offer clues about the company’s debt management and financial stability.
- Understanding revenue trends and operating profit margins helps assess pricing power and competitive pressures.
- Moreover, scrutinizing cash flow from operations and free cash flow highlights the company’s ability to convert accounting profit into actual cash and its capacity for future investments or returns to shareholders.
Hope you found this blog useful. Do share my blogs with your friends, peers and fellow investors.
Pingback: Stock Analysis, Here is a Powerful Framework - Venkatesh
Hi Venkatesh,
Very very helpful content.
I am a long term investor and I’m very keen to know abt fundamental.
I want to read ur full blog
But plz strt all these things in Hindi language also, becoz some people like me who r weak in English can’t proper get all the mean of contents.
So plz my humble request to u.
Thnku in advance.
Hi Pariksha, THanks for your comments. I do not have the bandwidth to handle the blog in dual language. One quick work around is that the contents can be copied into Google Translate, that would help you. Best of luck.