

Personal finance ratios! This concept draws inspiration from the Ratio analysis method employed in Financial Statement Analysis, a technique I hold in high regard. The seemingly innocuous figures have the potential to offer a plethora of insights, even beyond the specific parameters incorporated in the ratios. Within this blog, I am set to delve into various facets of personal finance, encompassing formulas for computation, the significance of personal finance ratios, and the depth of insights they can yield. (Featured image credits: Photo by Karolina Grabowska)
Yearly Trend is Important
As the years pass, you earn more and often switch companies to pursue better career prospects. This results in not only an increase in income but also an accompanying rise in expenses, in line with changes in life stages from being single, to married, and eventually having children. This dynamic has a ripple effect across various facets of personal finance. It becomes imperative to monitor specific ratios and values on an annual basis. This annual trend provides valuable insights into the evolution of your lifestyle, spending habits, and earning potential. You must evaluate this ratios on a yearly basis.
Hi, This is Venkatesh. I write on Personal Finance, Stock Investing, Productivity and Time Management. You will be interested to read more about me and the purpose of my website.
If you are interested in these topics do subscribe to my blogs. You would maximum receive 4 to 5 emails a month. Do check my Blog Index page for all my blogs.
You might also be interested to read these related articles:
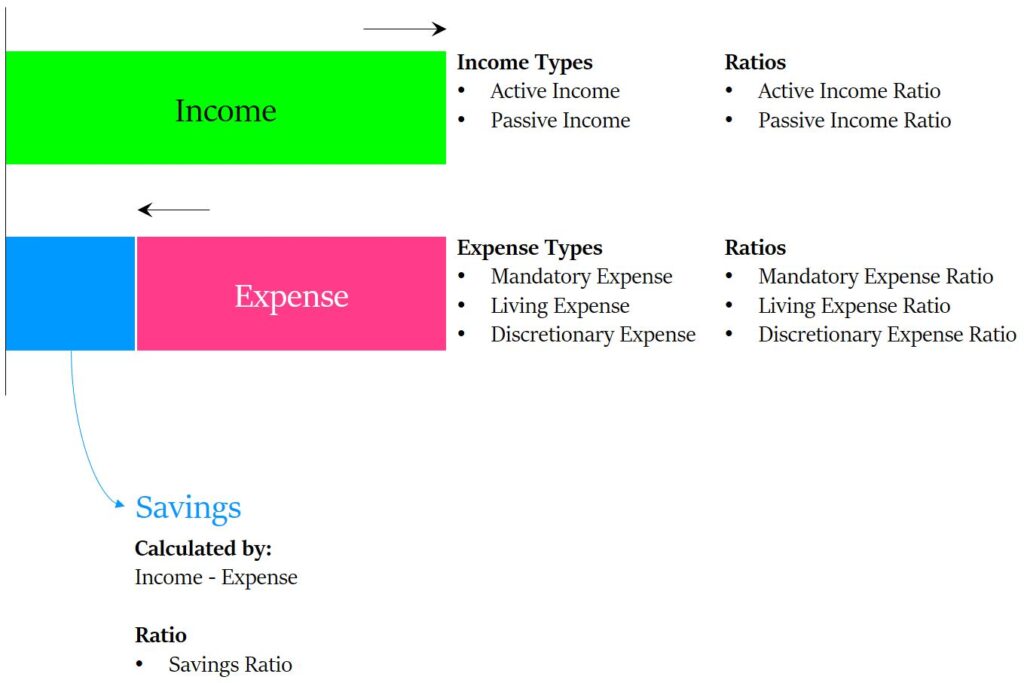
Income
Income is the money that we earn. There are two types of income:
- Firstly, there’s active income which stems from a profession and/or business.
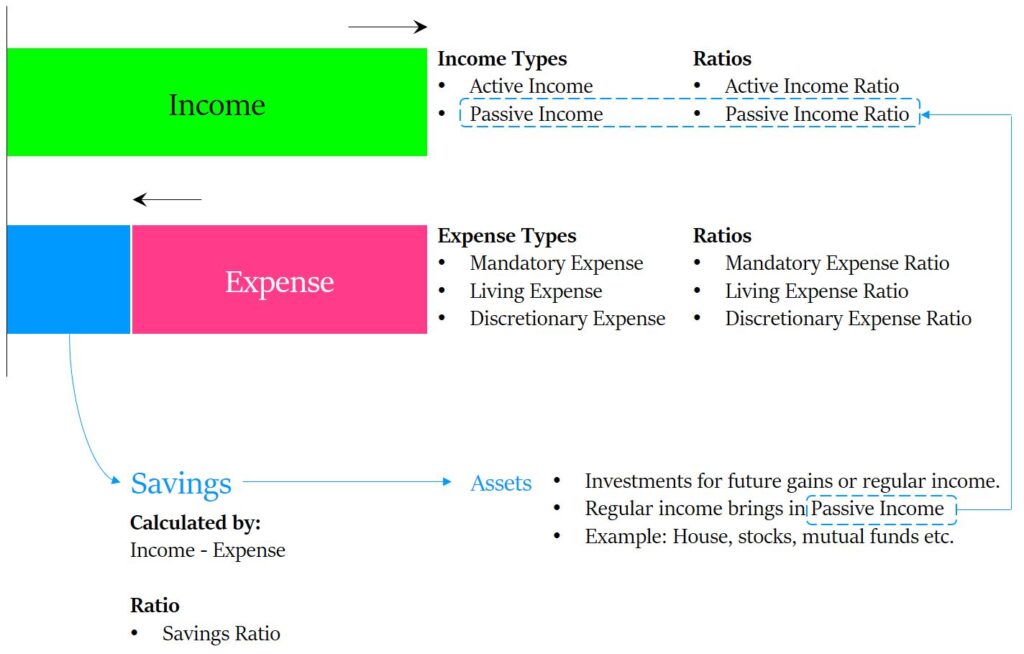
- Secondly, passive income is derived from your assets and investments, with these assets being acquired through savings. A few examples of passive income include dividends, bank interest, and rental income. Passive income is closely intertwined with the concept of Financial Freedom, a relationship we will explore in the subsequent sections of this blog.
A key distinguishing factor between these two income types is:
- With active income, you, as an individual, need to engage in work to earn it. Your time is the catalyst for generating active income.
- Conversely, with passive income, you merely need to make initial efforts to acquire and maintain assets. These assets subsequently generate income without continuous active involvement.
Total income = Active Income + Passive Income
Ratios
- Active Income Ratio = Active Income / Total Income x 100%
- Passive Income Ratio = Passive Income / Total Income x 100%

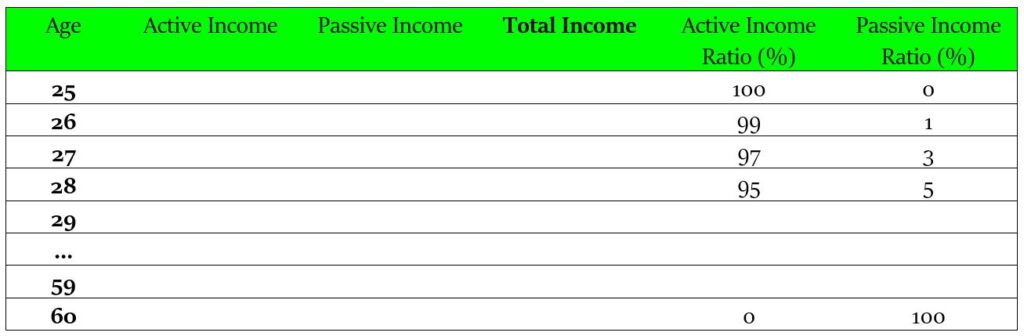
This ratio varies with your life stage.
- During the initial phase of your career, there is typically no passive income. All your income is sourced from your profession or business. Hence, the passive income ratio stands at 0%, while the active income ratio is at 100%.
- As you progress, you accumulate savings and invest in assets that generate passive income. Consequently, the passive income ratio should steadily increase throughout your life.
- Upon retirement, active income ceases, and your livelihood relies solely on passive income. Thus, the active income ratio drops to 0%, while the passive income ratio rises to 100%.

Yearly Trend
This aims to capture your active, and passive income and its associated ratios. An increasing trend in passive income ratio is a good sign.
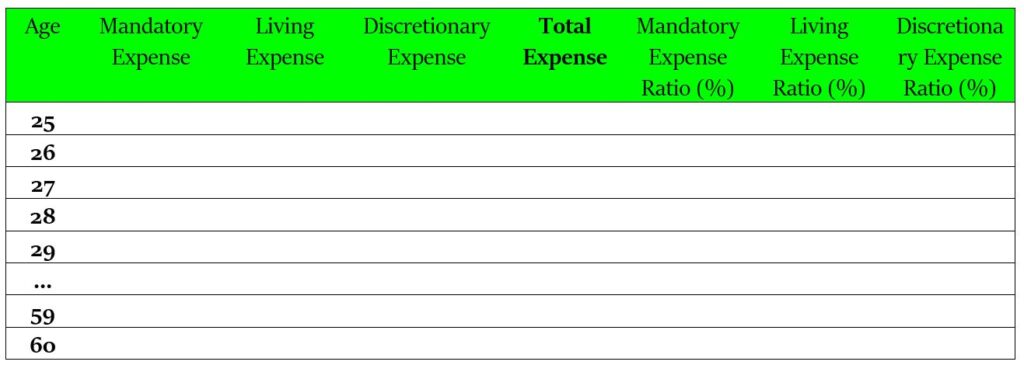
Expenses
Expenses are what consume our earned income. The most significant error in personal finance arises from treating every expense as identical. It is crucial to categorize expenses into three distinct types:
- Firstly, there are mandatory expenses, which encompass obligatory obligations and commitments.
- Secondly, living expenses encompass our needs, addressing living costs and daily livelihood expenses.
- Lastly, discretionary expenses denote luxury expenditures centered around our wants and desires.
Total expenses = Mandatory expense + Living expense + Discretionary expense.
You read my earlier blog “Expense, Did you see this way?”, for a better understanding of the above 3 kinds, common pitfalls and the below ratios.
Ratios
- Mandatory expense ratio: (Mandatory expenses) / (Total Income) x 100%
- Living expense ratio: (Living expenses) / (Total Income) x 100%
- Discretionary expense ratio: (Discretionary expenses) / (Total Income) x 100%
Benchmarks/Range
- The sum of these three categories should not exceed 100%. If this occurs, it means that the total expenses surpass the total earned income. In such a situation, borrowing becomes necessary to bridge the gap.
- If mandatory and living expenses alone sum up to 100%, then you must abstain from all discretionary expenses.
- Furthermore, the sum of all the aforementioned categories should ideally cap at 90%. Now, what does this remaining 10% entail? This portion is dedicated to savings, a topic we will delve into in the subsequent discussion.

Yearly Trend
The yearly trend encapsulates all the values and ratios mentioned above.
- A rising trend in either Mandatory or Discretionary expenses serves as a warning sign, as it directly affects your Saving ratio (as discussed in the following section).
- Living expenses naturally escalate with changing life stages, transitioning from being single to getting married, and eventually to starting a family with children.
- Mandatory expenses might experience a spike in the year you secure a significant loan such as for a house or a car.
However, these expenses should gradually taper off in subsequent years, owing to two factors: (1) Partial loan repayment and (2) Income increase.
Savings
This is the income not spent and left after all our expenses.
Savings = Total Income – Total Expenses
Ratio
- Savings ratio: Savings / Total Income x 100%
Benchmark/Range
There is no specific benchmark; the more savings, the better. Many sources of literature or rule of thumb suggest a minimum ratio of 10%. This saved amount is directed towards investments, each with varying objectives. These objectives encompass building a retirement corpus, generating passive income, and funding future goals such as children’s education.
Yearly Trend
An increasing trend in the saving ratio is considered ideal. A flat trend is still acceptable, but a declining trend requires your attention. There might be exceptions in certain years when:
- Your discretionary expenses are high due to factors like a foreign vacation.
- Your mandatory expenses increase following the acquisition of a significant loan for a house or car.
Financial Freedom
This is the dream for everyone. Various definitions exist in the literature, and perspectives on it differ among individuals. Essentially, it entails not requiring employment to cover expenses. The question arises: how can expenses be managed without active work?
As established earlier, active income originates from work, while passive income stems from assets. To achieve a state where expenses are sustained without active employment, passive income must be substantial enough to support those expenses.
Financial Freedom is attained when:
Passive Income >> Total Expenses.
Passive Income >> (Mandatory expense + Living expense + Discretionary expense)
The obvious next question is how to generate and increase passive income? The Answer is…
Investments
We observed that savings are directed towards investments. Several options are available, including property, stocks, mutual funds, and bank deposits. The returns generated from these investments pave the way for future passive income. Investments hold a pivotal role in personal finance:
- The absence of investments implies no potential for future passive income.
- Without passive income, financial independence is unattainable.
- Lacking financial independence leads to a life of financial dependence.
However, achieving the above is not an easy task. It requires starting early in life, devising a comprehensive expense plan, cultivating a habit of saving, and strategically investing in assets that generate passive income.
Yearly Trend
The values in this formula are monitored through the first two tables. The initial table provides data on passive income, while the subsequent table outlines total expenses. Take note of these values for each year. As your assets grow, your passive income also increases. The critical juncture is reached when this passive income reaches a level that aligns with total expenses – this marks the point at which Financial Freedom is achieved.
Debt
Short-term debt:
At times, within a span of a few months, your expenses may surpass your income. This situation leads to short-term debt, which you incur to address the immediate challenge. Such borrowings might stem from friends or credit cards, often linked to substantial discretionary expenditures. This practice is acceptable as long as it’s occasional and is followed by a corrective course of action in the ensuing months.
Long-term debt:
Long-term debts are undertaken to fulfil significant aspirations such as owning a house or a car. These debts are typically acquired from lending institutions such as banks and finance companies. Repayment involves covering both the principal and interest on a monthly basis, referred to as the EMI (Every Month Installment). Given the substantial magnitude of these debts, EMIs significantly augment mandatory expenses. When you commit to an EMI, it’s prudent to closely monitor the mandatory expense ratio. Generally, the ticket size for Long-Term debt far exceeds that of short-term debt.
Ratio
- EMI Ratio = EMI / (Total Income). This ratio helps to evaluate what % of your income goes toward EMI.
- EMI Coverage Ratio = EMI / (Total Income – Living expense – Other Mandatory expense). This ratio shows your capacity to pay the EMI after covering the living and other mandatory expenses
Benchmark/Range
EMI Coverage Ratio should be less than 1. If this value is more than 1, it indicates that there is no sufficient amount. In which case you need to borrow to fill the gap.
Note
The related ratio is:
House To Income Ratio = House rent / Total income
Before owning a house, you live in a rented house. This ratio shows the amount of your income that goes for a house rent.
Emergency Fund
An emergency fund consists of cash that you keep readily available to cover unforeseen expenses, like job loss, substantial medical bills, or unexpected home repairs. This fund serves as a safety net, preventing the need to borrow or tap into your long-term investments during challenging circumstances.
Ratio
- Emergency Coverage Ratio = Emergency Fund / (Mandatory + Living expense) a month
Benchmark/Range
- There are no benchmarks, as it is a matter of comfort for the individual.
- A minimum of 6 is preferable – This means that the emergency fund can cover 6 months of your mandatory and living expenses.
Yearly Trend:
- It’s probable that the yearly trend will witness a decline. This is due to our expenses increasing each year. Since the numerator (Emergency Fund) remains constant while the denominator grows, the ratio naturally decreases.
- This ratio signifies the number of months your emergency fund can cover your mandatory and living expenses.
- A standard comfort zone would center around a value of 6 (though this might differ based on the individual).
- A ratio dropping below 6 indicates that your expenses have risen, necessitating an enlargement of the Emergency Fund corpus.
An emergency fund is a very important pillar in personal finance. To know more, read my blog. No Fear when Emergency Fund is there.
Net Worth
This will ultimately serve as the yardstick for your financial success, providing a comprehensive snapshot of your financial standing. Over the course of your financial journey, you accumulate both assets and liabilities.
- Assets: These encompass where you allocate your savings. Common examples include Gold, Stocks, Mutual Funds, Deposits, and Property, among others.
- Liabilities: This pertains to the money you owe to external parties, often incurred through debts for property or car purchases.
Net worth reflects the intricate interplay between your assets and liabilities.
The formula for Net worth = Total Assets – Total Liabilities.
Consider a scenario where an individual owns a house purchased for 80 Lakhs, backed by a bank loan of, let’s say, 60 Lakhs. To external observers, the person’s total net worth appears as 80 Lakhs. The individual might even mistakenly perceive their net worth as 80 Lakhs. However, the true net worth emerges only after deducting the liabilities, which, in this case, amount to 20 Lakhs (80 – 60 = 20 Lakhs).
Benchmarks
The higher the positive number better you are. A negative value indicates signs of distress as you cannot settle your liabilities even after selling all your assets.
Yearly Trend
An ascending positive number each year signifies a positive trend. This is achievable through the expansion of assets, reduction of liabilities, or a blend of both.
Debt to Asset Ratio
This ratio also brings in different kind of relation between liabilities and assets.
Ratio
Debt to Asset = Total Liabilities/Total Assets
Benchmark/Range
Your liabilities should not go over 50% of your total assets. A 10% ratio or as little debt as possible is a great goal.
Solvency Ratio
The solvency ratio demonstrates your capacity to settle all current debts using your existing assets. This metric aids in assessing whether you’re capable of meeting your obligations in the face of unforeseen circumstances.
Ratio:
- Solvency Ratio = Net Worth/ Total Assets
Benchmark
The higher the ratio, the better your financial condition.
Final Thoughts
Personal finance ratios serve as powerful tools for evaluating and improving one’s financial health. These ratios provide valuable insights into various aspects of an individual’s financial situation, from their income and expenses to their savings, investments, and overall net worth. By meticulously tracking and analyzing these ratios, individuals can make informed decisions, identify areas that require attention or adjustment, and work towards achieving their financial goals. Whether it’s ensuring a healthy balance between income and expenses, building a robust emergency fund, or aiming for financial freedom through passive income, these ratios offer a structured framework to guide financial decisions and secure a stable and prosperous future.
Use the ratios to see where you stand relative to your financial goals and make changes to how you save, spend, borrow, and invest.
Hope you found this blog useful. Do share my blogs with your friends, peers and fellow investors.