

In our previous three blogs, we delved into a comprehensive exploration, covering the spectrum from the fundamentals of dividends to their critical role in investment decisions, along with insights from legendary investors. Now, in this latest blog, we turn our attention to the intricacies of dividend analysis and the different dividend metrics.
Specifically, we’ll explore the diverse range of dividend metrics, encompassing both qualitative and quantitative aspects, that play a crucial role in this analytical process. It’s important to note that grasping the knowledge shared in the preceding three blogs is imperative for a comprehensive understanding of the content discussed herein.
(Featured image credits: Mitchel Boot of unsplash.com)
Hi, This is Venkatesh. I write on Personal Finance, Stock Investing, Productivity and Time Management. You will be interested to read more about me and the purpose of my website.
If you are interested in these topics do subscribe to my blogs. You would maximum receive 4 to 5 emails a month. Do check my Blog Index page for all my blogs.
You might also be interested to read these related articles:
Dividend Metrics
Dividend analysis stands as a pivotal facet of fundamental analysis, carrying significant weight for both dividend and growth-focused investors. This analysis equips investors with a wealth of insights about a company, enabling sound investment decisions. In this regard, a range of Dividend metrics, and qualitative parameters come into play:
- Dividend Yield
- Dividend Payout Ratio
- Dividend Payback Period
- Dividend Coverage Ratio
- Dividend History
- Dividend Distribution Policy
The first four Dividend metrics involve quantitative analysis, dealing with concrete data, while the remaining two delve into qualitative analysis, addressing more intangible aspects. (Note: For a deeper understanding of soft and hard information or analysis, refer to my earlier blog on the Stock Analysis Framework.)
For each of these Dividend metrics, we will delve into their calculation formulas, what inferences they offer, and their inherent limitations. In this blog, we will explore the first two dividend metrics, with the remaining four covered in the upcoming blog. Let’s dive into these metrics.
Dividend Yield
What is it?
This ratio expresses the dividend amount a company pays in relation to its share price.
Information needed
(1) Total dividend for the year and (2) Market price of the stock.
Formula
- Numerator: Total dividend amount
- Denominator: Market price of stock.
Dividend Yield is expressed in % and its formula is:
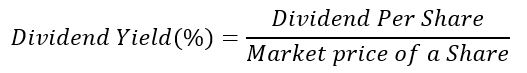
For example, if we take a share’s market price at INR 300 with an annual dividend of INR 12, the dividend yield calculates to 4% (12/300 x 100%).
Inference
- A high Dividend Yield indicates a substantial dividend concerning the market price, which can result from either a company’s generous dividends or a low share price.
- Conversely, a low Dividend Yield signifies a comparatively modest dividend relative to the market price, stemming from either modest dividends by the company or a high share price.
As we’ve explored in previous blogs, this dividend yield holds paramount importance for income-oriented investors when it comes to stock selection, screening, and valuation. However, for growth-focused investors, the dividend yield holds little to no significance.
Caution of Dividend Yield Trap
- Many dividend investors commonly err by selecting stocks boasting the highest dividend yields.
- While this strategy isn’t inherently flawed, it’s crucial to recognize that lofty yields can often be attributed to declining stock prices.
- Such price declines may stem from various factors, including the risk of diminishing or lower future earnings growth, or other issues that harm the fundamental aspects of the business, industry, or management.
This predicament is referred to as a “dividend yield trap.”
How to overcome the Dividend yield trap?
To make informed investment decisions, it’s prudent to refrain from solely relying on dividend yield. Instead, employ it in conjunction with other key metrics:
- Dividend Payout Ratios: Assess these ratios to determine the sustainability of a dividend.
- Dividend History: Scrutinize the dividend history, considering both payout growth and yield trends.
- Balance Sheet Analysis: Delve into the balance sheet, examining aspects such as debt, cash, assets, and liabilities.
Additionally, conduct a comprehensive evaluation of the company and its industry. Is the company susceptible to competitive pressures, weak demand, or disruptive factors? Furthermore, compare your chosen company’s dividend yield with that of its peers. If it surpasses the yields of its peers, this could signify potential trouble rather than an opportunity.
Dividend Payout Ratio
What is it?
The dividend payout ratio represents the portion of a firm’s net income distributed to its stockholders as dividends. The earnings retained by the company, not paid out to investors, are earmarked for reinvestment in growth opportunities, thus contributing to future earnings expansion.
Information needed
(1) Total dividend for the year and (2) Earnings from the income statement.
Formula
- Numerator: Total dividend amount
- Denominator: Earnings
It could be expressed as a Ratio or Percentage.
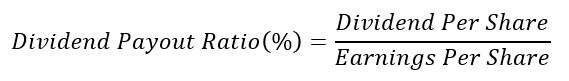
Consider a stock having EPS of 30 and a dividend of 3. The Dividend Payout Ratio is 10% (i.e 3 / 30)
Inference
What does a high or low dividend payout mean?
High Dividend Payout Ratio
- The majority of profits are typically distributed as dividends, with a smaller portion retained for future growth.
- It’s essential to recognize that no prudent management would opt for substantial dividends that compromise future growth prospects.
- Therefore, high payout ratios may serve as an indicator of limited profitable investment opportunities.
Low dividend payout ratio
- Management primarily directs the bulk of profits towards future growth initiatives, allocating a smaller portion for dividend distribution.
- This strategic approach stems from their recognition of compelling growth prospects where profits can be effectively reinvested.
- However, it’s important to exercise caution, as the success of these opportunities in yielding profitability in the future is not guaranteed.
High or Low Payouts? Which is better?
The below extracts are from an insightful 2003 paper by Robert Arnott and Clifford Asness. You can download the full paper here.
Thanks to Mr Gautam Baid for sharing his paper and his notes.
- Contrary to popular belief, companies with higher dividend payout ratios (i.e. they pay out more of their earnings) produce the highest expected earnings growth.
- Among other hypotheses, the authors put forth an explanation that “high payout ratios lead to more carefully chosen projects,” while “low payout ratios lead to, or come with, inefficient empire building and the funding of less-than-ideal projects and investments.”
- In other words, if management’s “bladder” of capital is too large, they’ll likely misuse it. Dividends reduce the size of that bladder and lead to greater discipline in capital allocation.
- It makes good business sense for companies to return the cash they can’t reinvest at high rates of return.
- With that cash in hand, shareholders can then decide for themselves the best place to reinvest.
- Companies can also return cash via buybacks. But there’s no implied “commitment” from management to maintain a certain level of buybacks each year.
- This is usually not the case with cash dividends, as most dividend-paying companies have a progressive dividend policy in which they aim to pay at least as much as the prior year.
- As such, buybacks provide less protection against management “empire building.”
- Further, management teams have broadly been inclined to buy back shares when the market’s good and then turn off the tap when the market is down. As investors, we know this is not wise capital allocation.
Conclusion
Dividend metrics play a crucial role in fundamental analysis and investment decision-making. They provide valuable insights into a company’s financial health, its commitment to shareholders, and its growth prospects. By considering metrics such as dividend yield, payout ratio, dividend history, and dividend distribution policy, investors can make more informed choices. However, it’s important to remember that no single metric should be used in isolation. A comprehensive analysis that includes both quantitative and qualitative factors is essential.
In the next blog, we understand in detail the remaining dividend metrics.
Hope you found this blog useful. Do share my blogs with your friends, peers and fellow investors.