

In this blog, we will continue to discuss the remaining 4 dividend metrics. To better understand this blog, please read my previous 4 blogs on dividends:
- A-Z of Dividends
- How dividend analysis is important in investment decisions
- Legends’ view on Dividends
- Dividend Metrics – Part 1 covers Dividend Yield and Dividend Payback Ratio
Now continuing with the third metric.
Hi, This is Venkatesh. I write on Personal Finance, Stock Investing, Productivity and Time Management. You will be interested to read more about me and the purpose of my website.
If you are interested in these topics do subscribe to my blogs. You would maximum receive 4 to 5 emails a month. Do check my Blog Index page for all my blogs.
You might also be interested to read these related articles:
Dividend Payback Period
What is it?
This metric determines how many years it will require for a dividend growth stock to recoup the investor’s initial purchase price. For instance, if you bought a Rs. 50 stock that yields Rs. 2 in annual dividends, it would take 25 years to recover your initial investment through dividends alone.
This calculation assumes a constant dividend, but in most cases, dividends increase annually. Consequently, it would take fewer than 25 years to achieve the payback.
A shorter dividend payback period is indicative of a more favorable scenario.
Information needed
To compute the dividend payback period for rising dividends, you must have:
(1) The stock price, (2) The anticipated growth rate, and (3) The annual dividend payment.
It’s important to note that this calculation relies on an assumption: the Expected Dividend Growth. This introduces an element of subjectivity, which sets it apart from the other two metrics discussed in the previous blog.
Formula
An excel is required to calculate this metric. One such excel can be downloaded from https://www.suredividend.com/wp-content/uploads/2015/10/Dividend-Payback-Period-Calculator.xlsx
Dividend Coverage Ratio
Investors often focus on dividend yield but may not give adequate consideration to the safety and quality of the dividend. This ratio assesses the safety and quality of dividends.
In addition to distributing dividends, companies must generate sufficient cash flow in the long term to fund future endeavors, such as capital expenditures (CAPEX) and servicing any debt they may have. This investment in the future, known as CAPEX, is crucial as it contributes to earnings growth, which can result in higher dividends.
There are three Dividend Coverage metrics:
- Earnings Dividend Coverage Ratio
- CFO (Cash Flow from Operations) Dividend Coverage Ratio
- FCF (Free Cash Flow) Dividend Coverage Ratio
Note: I was introduced to this idea from an article by Ken Faulkenberry. A detailed write-up of these three ratios can be read here.
Earnings Dividend Coverage Ratio
This measures the number of times that a company can pay dividends to its shareholders from its earnings.
Information needed
(1) Total dividend for the year and (2) Earnings from the income statement.
Formula
- Numerator: Total dividend amount
- Denominator: Earnings
It could be expressed as a Ratio or Percentage.
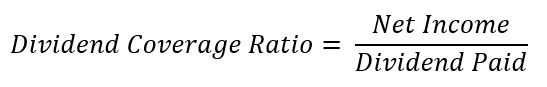
For example, let’s take a stock, ABC. It has a Net Income of Rs. 200 Crores and has declared a dividend of Rs. 40 Crores. The Dividend Coverage Ratio is 5 (200 Crores / 40 Crores).
Inference
- A ratio less than 1 signifies that there aren’t enough earnings to cover dividend payments.
- A ratio greater than 1 indicates that the generated earnings are sufficient to fulfill dividend obligations.
- A ratio exceeding 2 is deemed healthy, as it allocates funds for growth beyond dividend disbursements.
Limitations
- This ratio relies on net income, which doesn’t represent actual cash flow.
- Consequently, even with high net income, there’s no assurance of sufficient cash flow to cover dividend distributions.
- Thus, the next ratio provides a more rigorous evaluation.
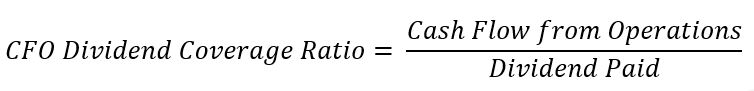
CFO Dividend Coverage Ratio
The earlier coverage ratio based on earnings utilizes ‘Net Income,’ which doesn’t necessarily represent true earnings. The figures presented in the ‘Profit & Loss statement’ can be subject to manipulation, although not as easily as ‘Cash Flow from Operations.’
This metric reveals whether the company is generating sufficient cash flow from its fundamental business operations to sustain dividend payments.
Information needed
(1) Total dividend for the year and (2) Cash flow From Operations available in the Cash Flow Statement.
Formula
Inference
- A ratio below 1 signifies that the company isn’t generating adequate cash to cover dividend payments, necessitating borrowing for dividend disbursements. This also extends to funding CAPEX, which is more critical than growth.
- A ratio equal to 1 indicates that the company generates enough cash to pay dividends but falls short of supporting CAPEX. Investment in CAPEX is vital for future earnings growth and the augmentation of dividends.
- A ratio of 4 or higher is regarded as favorable, with greater numbers signifying increased safety.
Limitations
This metric falls short of dividend coverage post the CAPEX. The next ratio satisfies the purpose.
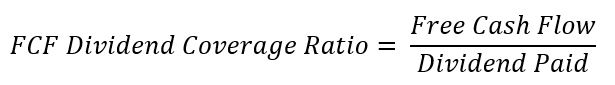
FCF Dividend Coverage Ratio
Free Cash Flow = Cash Flow From Operations (CFO) – Capital Expenditures
This metric tells you whether the company is having enough cash left from operations after capital expenditures to support the dividend.
Information needed
(1) Total dividend for the year and (2) Cash flow From Operations and CAPEX from the Cash Flow Statement.
Formula
Inference
- A ratio below 1 implies that the company must resort to borrowing to fulfill dividend obligations, posing a risk of potential dividend reduction or elimination.
- A ratio equal to 1 lacks an adequate safety margin, particularly after considering CAPEX and dividend payment.
- A ratio of 2.5 or higher is deemed favorable, with increased numbers signifying greater safety.
Dividend History
This isn’t a distinct metric; rather, it involves the examination of dividends disbursed in the past several years. This analysis yields critical insights:
How many years has the company paid a dividend without break?
- A longer span of years is preferable as it provides a more comprehensive perspective.
- This can offer insights into how the business fared across various economic cycles and the consistency of dividend payouts during both favorable and adverse periods.
Is the Dividend amount constant, growing or erratic?
- Constant – Less favorable, as the expectation is for dividends to increase over time.
- Growing – A positive indicator (provided it aligns with earnings growth).
- Erratic – Less favorable, as it poses challenges to dividend predictability.
Is the Dividend Payout Ratio constant?
- A relatively stable Dividend Payout Ratio is preferable, as it enhances predictability.
- A fluctuating Dividend Payout Ratio introduces uncertainty in forecasting future dividends.
Dividend Distribution Policy
This is purely a quality metric. No numbers are involved.
- Indian markets regulator SEBI has made it mandatory for the top 500 listed firms to have a “dividend distribution policy.”
- This helps investors get some visibility on returns from their investments in listed firms and also identify stocks matching their investment objectives.
- Companies will have to inform the shareholders of their plans to utilize extra profits and the parameters/rationale behind the dividend payout ratio.
- Such a policy reduces some uncertainty related to Dividend payout.
- Check if your company has such a policy on their website or in their recent Annual report, which will share their views on utilizing profits, expected payout, etc., which become handy for investment decisions.
- The policy may give some hidden pointers for future growth!
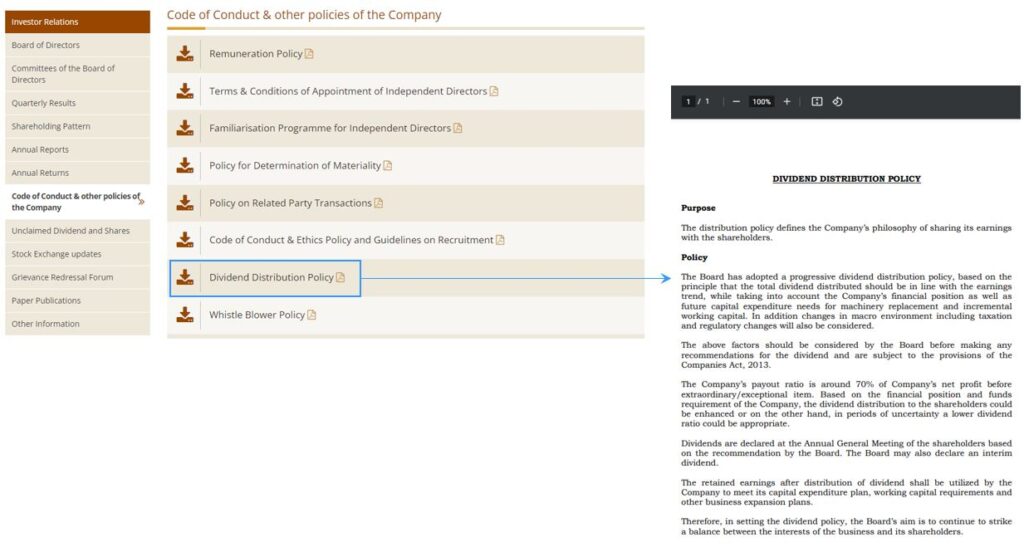
Where and how to find this policy document?
Option 1 – Internet Search: In your search engine type “Company name + Dividend Distribution Policy”. The search result will lead you to the needed policy document.
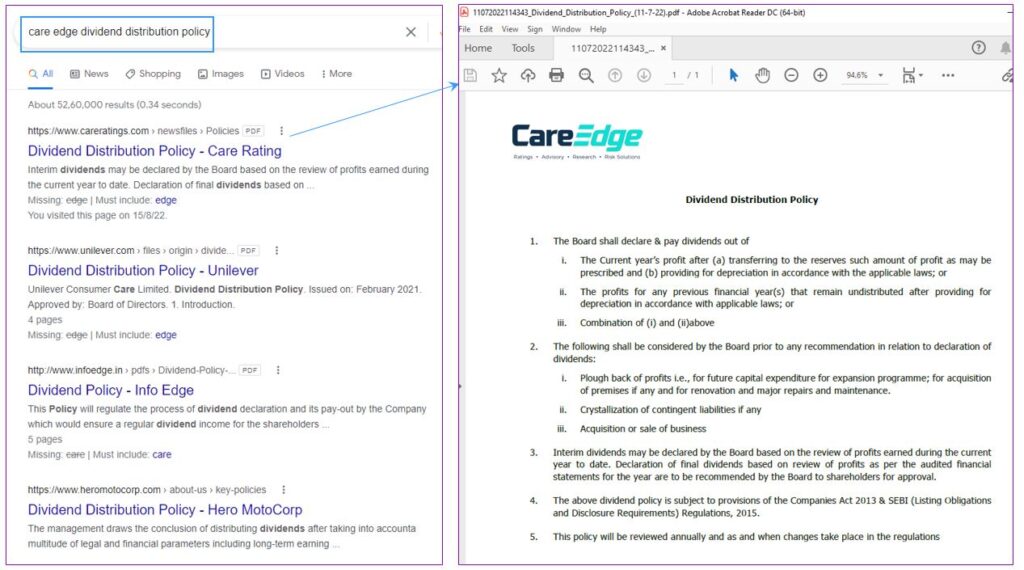
Option 2 – Company Website:
The “Investor” section in the company website will have the “Dividend Distribution Policy” document.
Conclusion
Dividend metrics are a crucial aspect of fundamental analysis for investors, whether they prioritize income or growth. Dividend yield provides a quick measure of income relative to investment, but it should not be viewed in isolation. Dividend payout ratios, dividend payback periods, and dividend coverage ratios offer deeper insights into the sustainability and quality of dividends. A company’s dividend history and distribution policy further shed light on its commitment to shareholders. By understanding these metrics, investors can make more informed decisions.
In the next blog, I will show a holistic approach to Dividend analysis covering all these metrics using two stocks. This will help to evaluate the safety and quality of Dividends.
Hope you found this blog useful. Do share my blogs with your friends, peers and fellow investors.