

In the last five blogs, we saw the A-Z of Dividends, their importance in fundamental analysis & various dividend metrics. This blog will discuss a practical approach for applying these learnings using a company from the listed space.
I consider the example of VST Industries. One reason to consider this is because I have studied a few companies in depth as part of industry analysis. Thus, I have the needed inputs and data for writing this blog with the least effort.
Hi, This is Venkatesh. I write on Personal Finance, Stock Investing, Productivity and Time Management. You will be interested to read more about me and the purpose of my website.
If you are interested in these topics do subscribe to my blogs. You would maximum receive 4 to 5 emails a month.
You might also be interested to read these related articles:
DISCLAIMER
Kindly do not read this blog without reading this disclaimer!
The company considered in this blog is used only for educational purposes. It is not any kind of recommendation be it ‘buy’ or ‘sell’ or ‘hold’.
This blog covers only the Dividend analysis of the stock and not the entire fundamental analysis covering Financial Ratio analysis, Industry Analysis, Management analysis, Growth analysis etc. So in a way this dividend analysis is incomplete in the bigger view of fundamental analysis. This incomplete analysis MUST not be used for any kind of investment decision.
This blog may give the current outlook of this company as good. However, remember anything can happen in future. The wide range of possibilities could be:
- The company may reduce/stop dividends,
- Regulatory measures in this industry may affect the company’s operations and thereby earnings,
- The stock price goes down 50% from the current levels and stays in that range for an indefinite period thereby causing notional or permanent loss of capital.
- Decline in growth prospects etc.
So if you want to buy this stock, do it based on your own analysis, understanding of the possible risks, and ‘own’ conviction and not based on this blog alone. If you brought based on this blog alone and suffer a loss, do not blame me. My reference to this stock is purely for educational purposes. If anyone is to be blamed, it is you for your decision to buy based on this blog alone!
Let us go through the analysis step by step that we discussed in my previous 5 blogs.
Any analysis starts with data collection. Dividend analysis also needs data. So, what all data is needed?
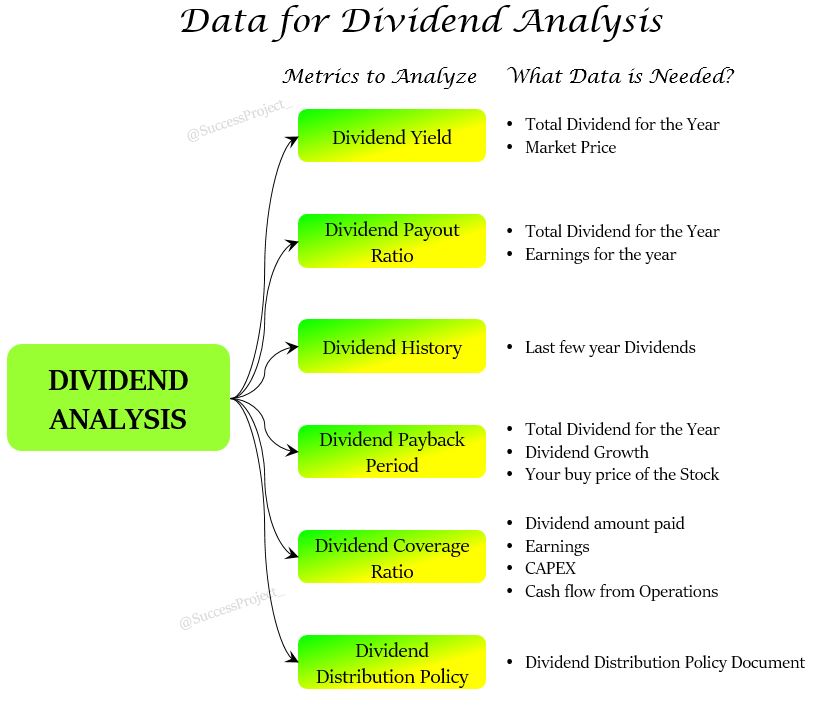
Most of the data can be gathered from the Annual reports of the company or public domain information. Let us understand each of these a bit more.
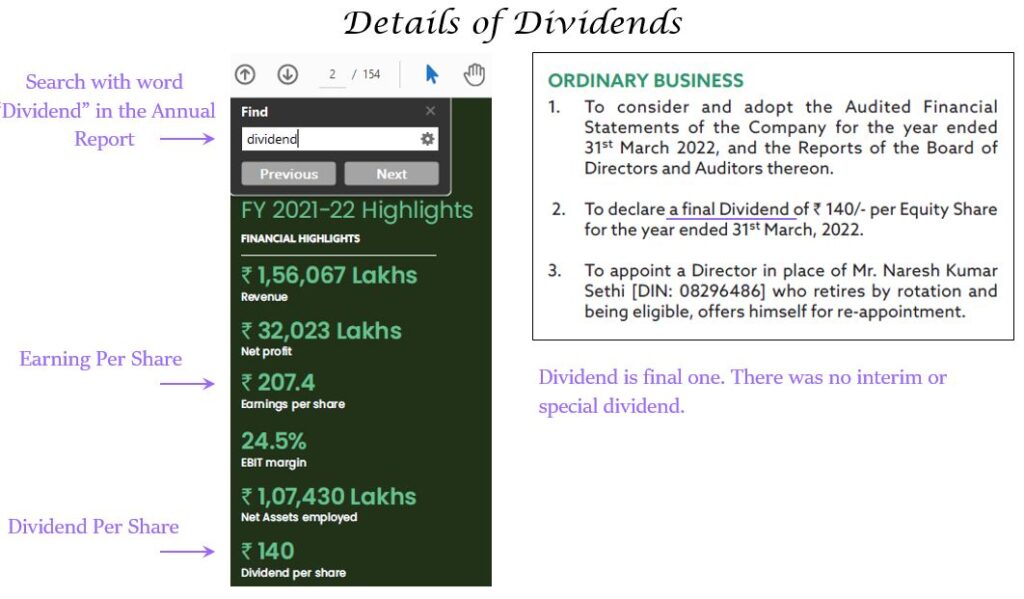
Dividend
This information is available in the company’s annual report. Pick the recent year’s annual report and search for the word “Dividend”. There could be multiple usages in the annual report. Check each of them and you will get the value of the dividend and details of interim, final and special dividends. Sample is shown below.
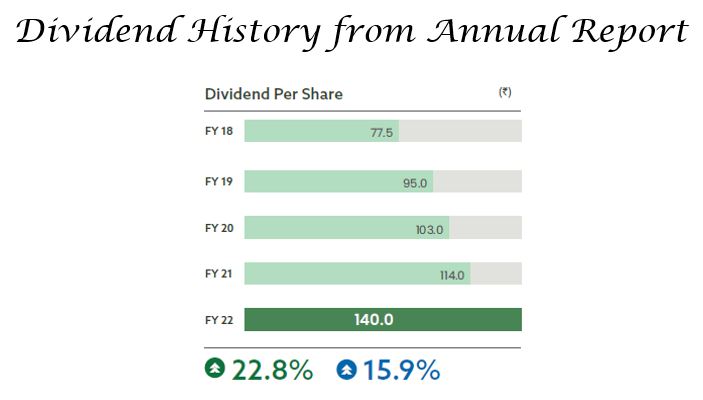
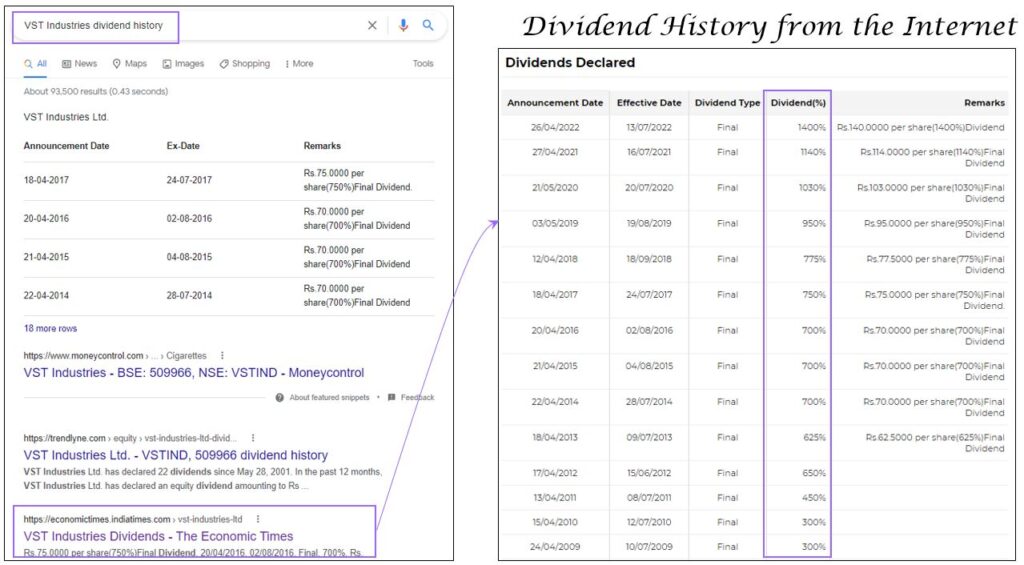
Dividend History
- This is available in the company’s annual report and public domain
- Usually companies share the last 5-year trend of dividends in their annual report
- If that is not available or looking for a longer period of dividend history, then it is available in the public domain
Both these have been shown in the below image.
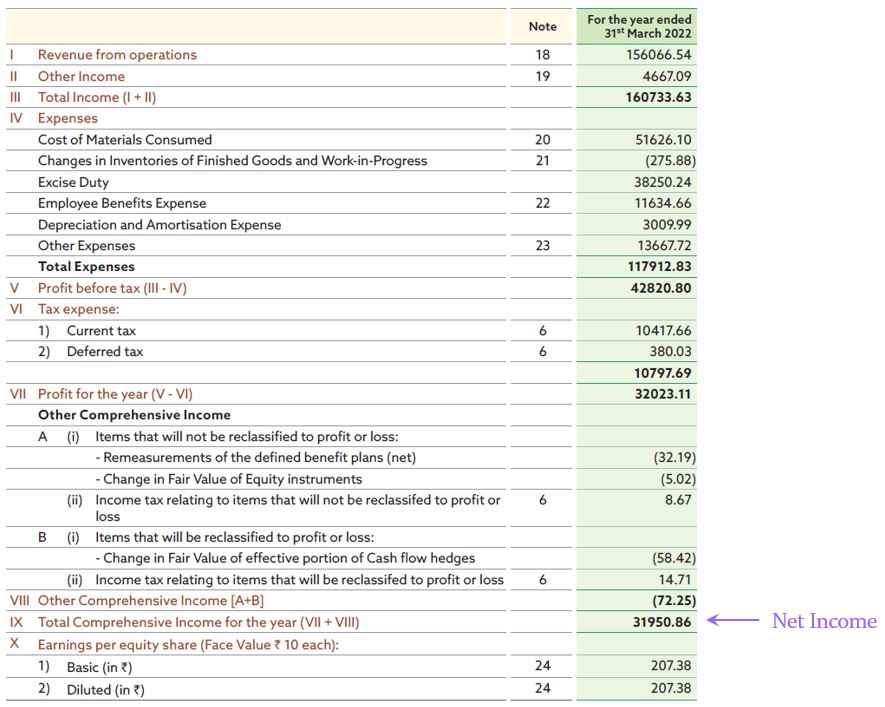
Net Income
Details of Net income is available in the Profit & Loss statement of the company.
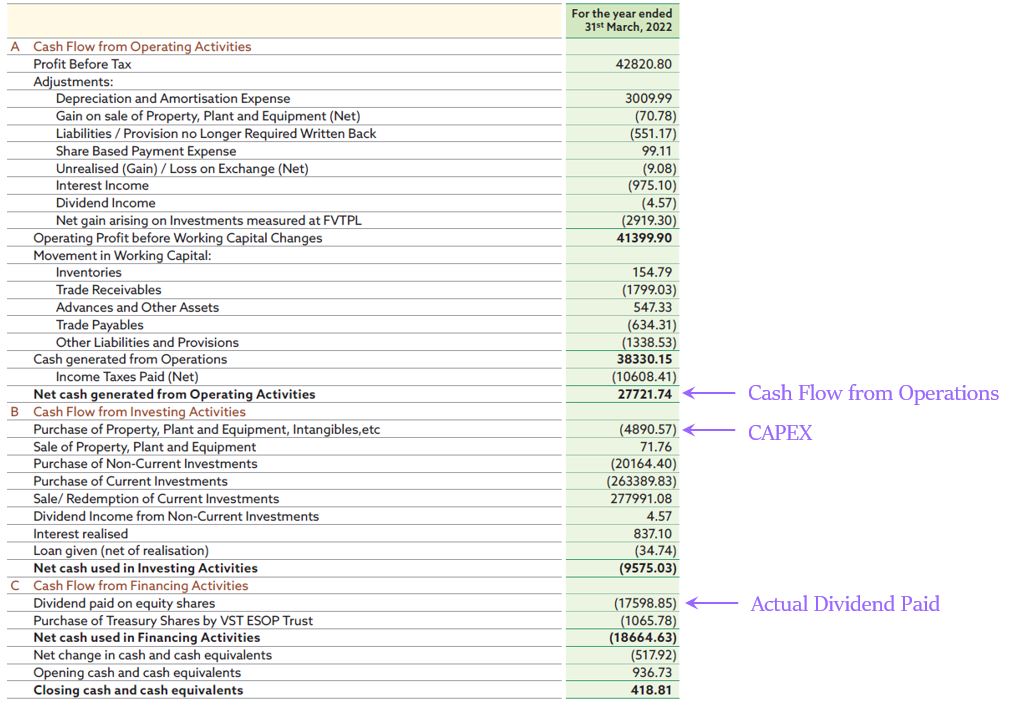
Cash Flow from Operations, CAPEX & Dividend Outflow
- These inputs are needed to calculate the Dividend Coverage Ratios.
- Dividend outflow is the total amount the company is paying out as dividends to all its shareholders in the financial year.
- This information is available in the cash flow statement. (This is published after the balance sheet and income statement)
- The cash flow statement usually has three parts and you need to pick the needed information from them:
- Cash flow from Operations: Available at the end of the heading “Cash Flow from Operating Activities”
- CAPEX: Shown under the heading “Cash flow from Investing Activities”
- Dividend outflow: Listed under the heading “Cash flow from Financing Activities”.
The image below for VST Industries.
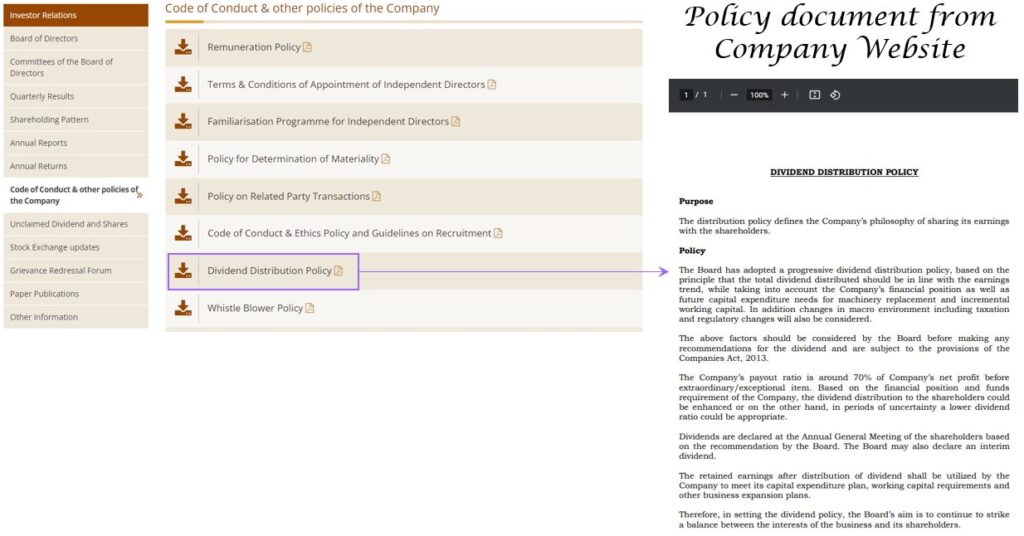
Dividend Distribution Policy
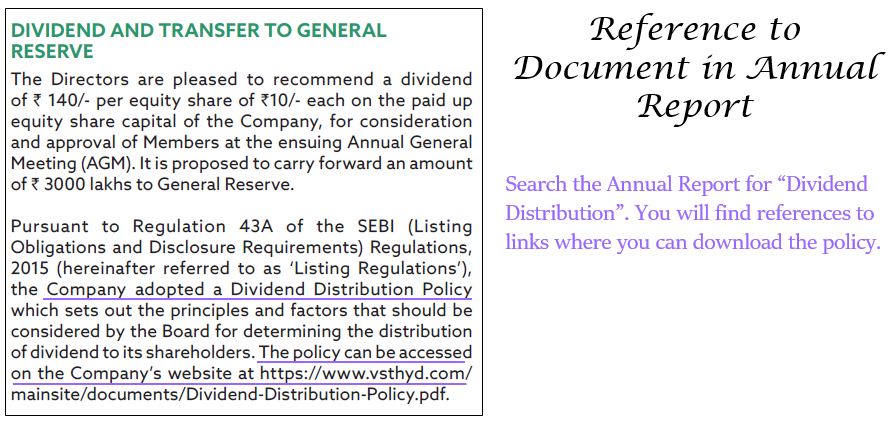
This can be found on the company website (or) in the annual report. Both options are shown in the below two images.
Stock Price
The stock price is available everywhere like finance websites and business channels. An internet search gives the values. It is a very dynamic value that changes every day (In fact every second during trading hours). The image below guides you to search for the stock price.
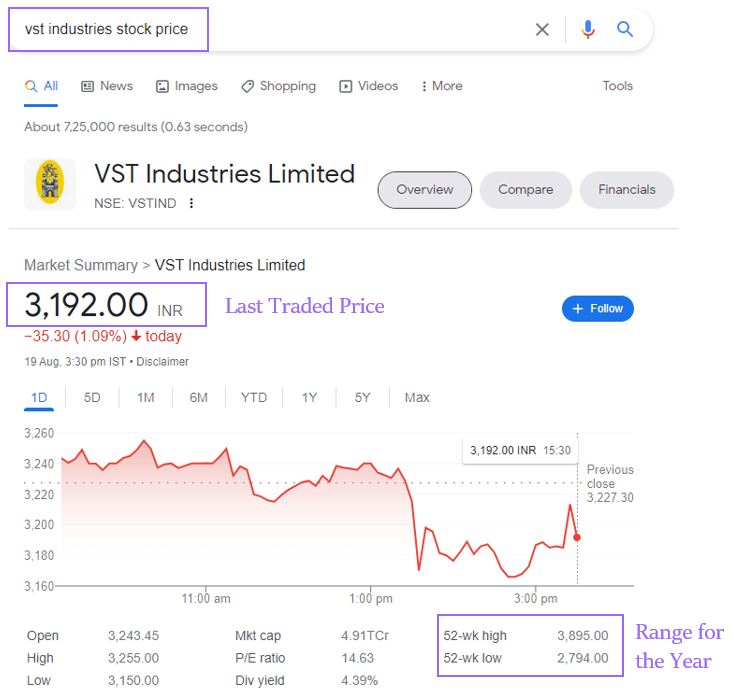
In this case, the Last Traded Price (LTP) was INR 3192, the 52-week range was from INR 2794 to 3895. Which value should one take? It is very subjective that three different people come out with three different views. Considering the:
- Lowest value of 2,794 gives a high dividend yield
- Highest value of 3,895 gives a low dividend yield
- LTP gives a dividend yield that you get if invested at the current price
The lowest and high prices are two different extremes. These values will skew the output on one side i.e. High or low dividend yield.
Accuracy is not important. But a reasonable margin of safety is. I consider a value of 3250 which could be the mid-range of high-low values and closer to the LTP. This INR 3250 will be considered in all the calculations of this blog.
Calculation of Metrics, Analysis & Interpretation
Dividend Yield
Information on Total dividends and stock price are needed to calculate dividend yield.
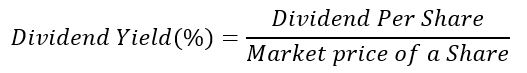
In this case, it works out to: 4.3% (Final Dividend, INR 140 / Market price, INR 3250 x 100%).
Inference
Is this yield of 4.3% high or low?
- Compare this with the benchmark of prevailing interest rates of 5% on 1-year deposits.
- The dividend yield is lesser than what one can get from deposits.
- If someone is investing only for dividend income, this yield might be unattractive.
- However, the analysis must be holistic to arrive at a decision after analysing all the metrics.
Then what case could make this investment attractive?
Maybe a yield of 5.5%. This can happen in future: (1) When the dividend increases or (2) The stock price goes down:
- The dividend increases are a separate topic which we will discuss in “Dividends History”.
- Stock prices going down to 2500 may give a yield of 5.5%.
- So this dividend yield gives a rough pointer of the market price at which the yield is more attractive than a 1 year fixed deposit.
- If you wait and buy the stock when the price touches INR 2500 would get a yield of 5.5%.
Remember that no one can time the markets. This stock may never go down to the price of 2500!
Your Taxation Status
- Your taxation status decides if the yield is attractive or not
- For someone who is at a 10% slab will enjoy a post-tax return of around 3.87 (90% of 4.3%) and another person at 30% slab will get a post-tax return of 3% (90% of 4.3%).
- So your taxation status does have an impact on picking a stock for dividends & dividend yield.
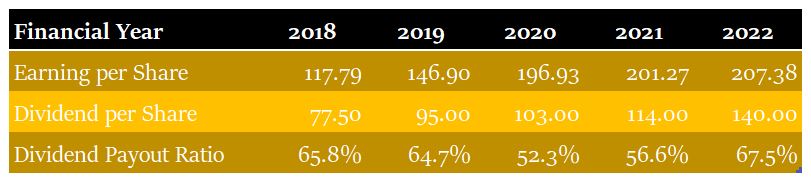
Dividend Payout Ratio
This can be calculated using the total dividends and earnings for the year.
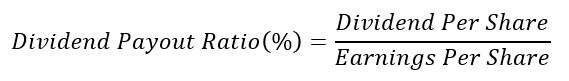
In this case, it works out to: 67.5% (140 / 207.38 x 100%)
Inference
- The company shares 67.5 of the profits with shareholders
- The company reinvests 32.5% in itself for future growth expansion and machinery replacement
- This 32.5% reinvestment of the company’s earnings would LIKELY (Not definitely!) grow future earnings
- This would LIKELY (Not definitely) translate to an increased dividend in future
- This also is an indication that the management has identified growth opportunities that may maximum needed 32.5% of the net profits.
Dividend History
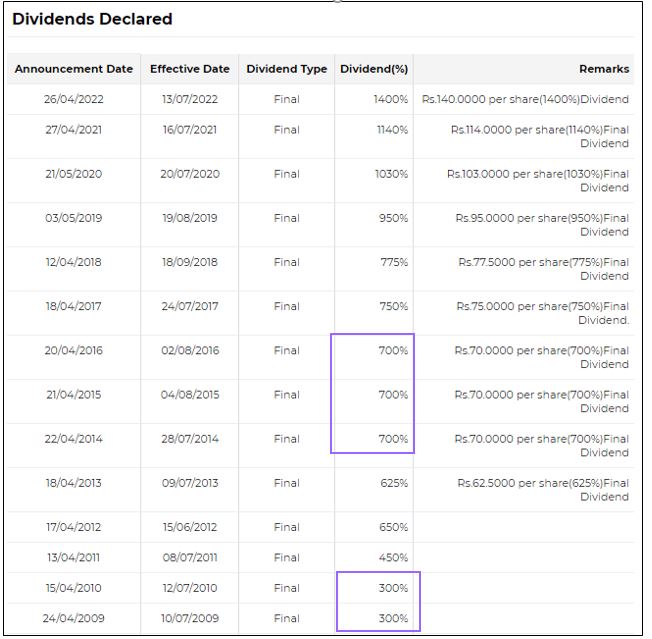
Inference
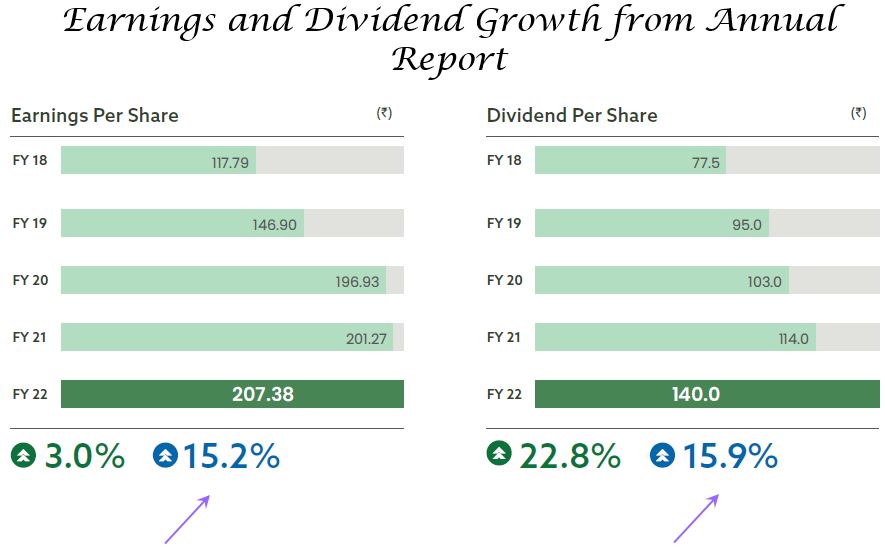
- The dividend payout from 2009 to 2022 has increased in most of the years while maintaining the same payment for some years i.e. Rs. 70 in 2015, 2015 and 2016 / Rs.30 in 2009 and 2010.
- For the 10 years from 2012 – 2022, the Dividend has doubled from Rs.65 to Rs.140.
- This increase in dividends cannot come simply without support from increasing earnings.
- This is evident by comparing the 5-year earnings growth and dividend growth. They have a similar CAGR of 15 to 16%.
A common trap that most are tempted to fall
- Will these earnings and dividends grow in future also by 15%?
- Will next year’s Dividend be at Rs.160 against the current Rs.140 to reflect this 15% growth?
- Will the Dividend in 10 years shall double from the present Rs.140 to around Rs.280?
The hard truth is… no one has the answer. Not even the company board. They can decide only based on the earnings for the year.
But you can get answers with reasonable certainty with the understanding of the business environment, sector, company’s growth plans, earnings analysis, company management etc. That however is a different analysis. Future dividends can be evaluated only after doing other analyses.
Let us in this case ASSUME, that you did the other analysis and are certain that the dividends in the future years would increase. You see a Dividend of around Rs.155 in the next financial year and around Rs.170 the year after that. The dividend yield in those years for your purchase price of 3250 would be 4.8% and 5.2%.
Always remember
- Not to project the past indefinitely into the future. There are a lot of uncertainties and many unexpected things can happen.
- When making investment decisions based on future projections i.e. Future dividend growth, remember that you are embracing a certain element of risk.
Historic data analysis can be extended to “Dividend Payout Ratio”. This helps to understand the policy of the management with regard to the Payout ratio. In this case, it can be seen that it was in the range of 50 – 70%. (The below historic numbers are from the previous image)
Dividend Payback Period
- At a constant dividend of Rs.140 in the future years and a purchase price of Rs.3250, the dividend payback period is 23 years (Rs.3250 / Rs.140).
- This means after 23 years, you can get back your original investment price of 3250 in the form of yearly dividends.
- This appears too long, but in a real scenario, you expect the dividends to increase every year.
- In the dividend history, we saw the last 5-year dividend CAGR was 15%. However, leaving room for uncertainty and having some margin of safety, let us assume that there could be a 12% growth.
- The payback period, in this case, would be in the 12th Year.
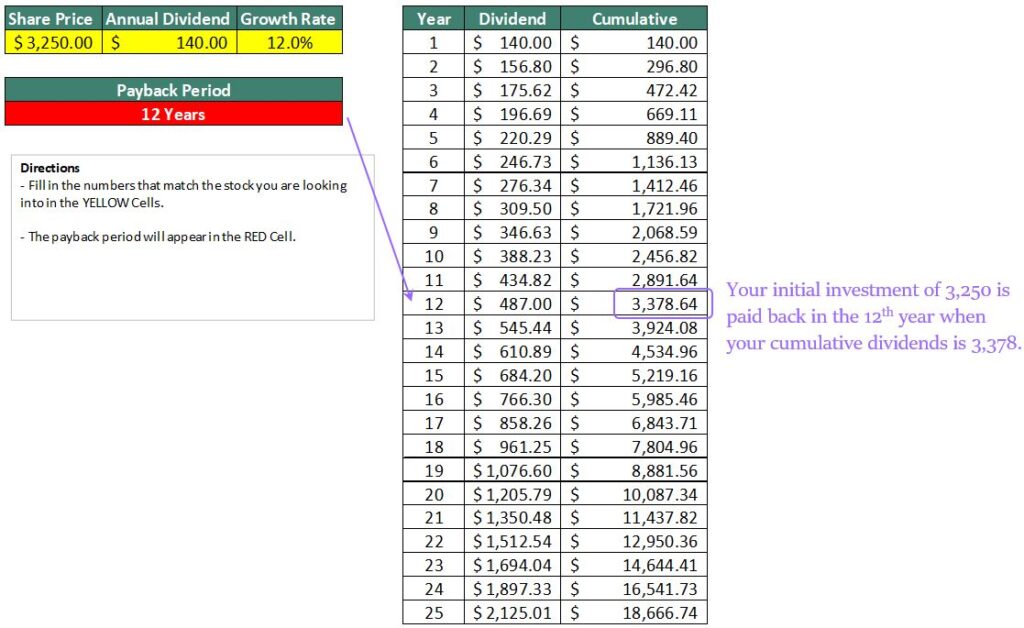
You can download this calculator from: https://www.suredividend.com/wp-content/uploads/2015/10/Dividend-Payback-Period-Calculator.xlsx
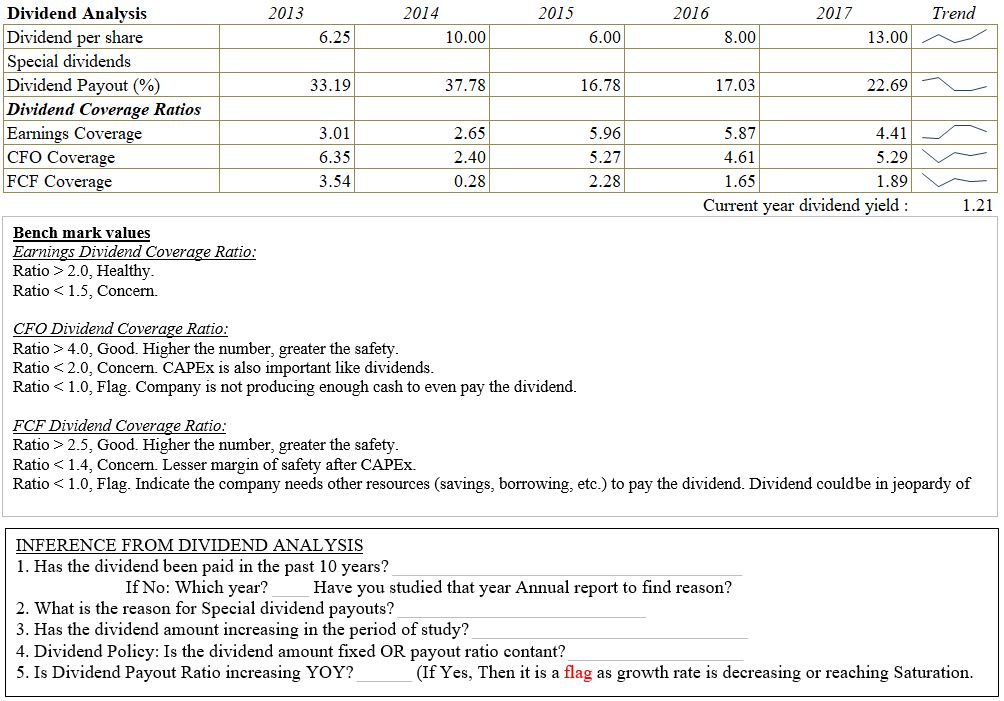
Dividend Coverage Ratio
Here we calculate three Dividend Coverage metrics:
- Earnings Dividend Coverage Ratio
- CFO (Cash Flow from Operations) Dividend Coverage Ratio
- FCF (Free Cash Flow) Dividend Coverage Ratio
These three metrics are calculated in the image below. The data needed to calculate is shown in this blog earlier, under the heading “Data Collection”. The formula is shown in the previous blog.
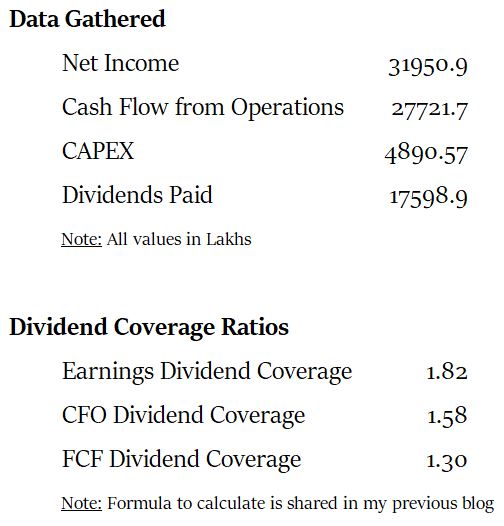
Inference
- The FCF Dividend Coverage ratio indicates the most stringent metric. The reason, it considers the real cash earnings from operations post CAPEX against the dividends paid.
- The ratio is 1.30, which means that post CAPEX from cash generated from operations, the Free Cash Flow covers more than the dividend.
- So the company need not borrow to pay dividends.
For all these ratios, there are benchmark values and the inference of these values. Do check my previous blog for details and interpretation.
Dividend Distribution Policy
The first positive aspect is that the company has a “Dividend Distribution Policy”. This is favourable when compared to a company not having it. Read through the policy and gather inferences.
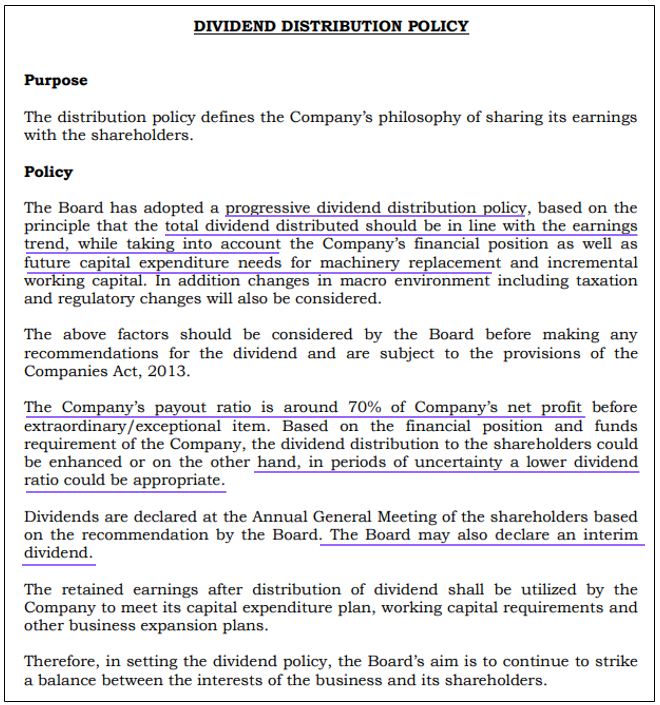
Inference
- Progressive dividend distribution, which means an increase in future dividends. This aligns with the dividend history that we just saw. There was an increase in dividends or the same dividend, but not a lesser amount.
- However, with a caveat that the distribution will be in line with earnings trend – If earnings grow the dividends will grow.
- The company factors dividend based on future capital expenditures – So the message is future growth will not be compromised at the expense of paying fatty dividends today.
- The normal payout is 70% of the earnings. However, during the uncertain period, this will reduce.
- The board may declare interim dividends in future. At present, it declares only final dividends as evident from the dividend history that we just saw.
The inferences from the policy agree fairly with other analyses of other metrics.
Summary and Conclusion
- You would have seen “hands-on” how to approach dividend analysis.
- There is much more than the dividend per share and dividend yield.
- The quality and sustainability of the dividends are more important.
- Normally this analysis is not stand alone.
- This leads to other areas of fundamental analysis i.e. When you look for growing dividends, you need to analyse the earnings growth.
- Earnings analysis and projection is an altogether different analysis where you need to consider the future growth opportunities, companies’ investments in it and the probability of profitability from such growth.
Such an analysis helps to evaluate the quality and sustainability of dividends.
Try to build these metrics in a checklist, so that you do not miss any metrics. You will get a birds eye view factoring all aspects of dividends. One sample below is shown. Do build your checklist that best suits your style and requirements.
Hope you found this blog useful. Do share my blogs with your friends, peers and fellow investors.
Absolute genius write up