

Cash flow ratios are powerful financial metrics that offer a comprehensive view of how effectively a company manages its cash resources. In turn provides invaluable insights into a company’s operational efficiency, liquidity, and overall financial health.
In this blog, we’ll explore six essential cash flow ratios: Cash Realization Ratio, Operating Cash Flow Ratio, Earnings Quality, Free Cash Flow to Sales, Cash Generating Power Ratio, and External Financing Index Ratio. There are few more ratios, that will be covered in the next part.
By understanding and analyzing these ratios, you can gain deeper insights into a company’s financial performance and company’s strategy.
Dear Reader,
This blog is part of a larger series. For a comprehensive understanding of this blog, we recommend reading the previous blogs.
Background of my Interest on Cash Flow Ratios
Years ago, when I first delved into the realm of investing, my focus was primarily on mastering the analysis of balance sheets and income statements. The cash flow statement, on the other hand, seemed less engaging and was often overlooked. However, a pivotal moment came in 2015 when I stumbled upon a remark by an investor (whose identity escapes me), advocating for prioritizing the analysis of the cash flow statement over other financial statements. At times, his analysis ends and does not look at the company further.
Intrigued by this perspective, I began to explore the intricacies of cash flow analysis in greater depth. I read a lot on analysing these statements. My learnings are what I have been sharing in this blog series. Towards the end of my learning journey, I accidentally came across a blog by Jae Jun, where he discussed the significance of cash flow ratios. This revelation opened up a new avenue for financial ratio analysis, particularly focusing on cash flow metrics. Since then, the analysis of cash flow statements and ratios has become an indispensable part of my stock analysis toolkit.
Time Series Analysis of Cash Flow Ratios
The majority of the ratios discussed in this, and the following blog require a time series analysis, typically spanning the past 5 to 10 years. While a single-year standalone ratio can offer valuable insights, delving into a time series analysis unveils a multitude of insights. In this blog, we have covered the details of these ratios, including their formulas and examples. Subsequent blogs will delve into conducting time series analyses of these ratios using live examples.
Now, let’s delve into the 6 key ratios discussed in this blog.
Cash Flow Ratios
The ratios discussed in this blog use numbers from Cash Flow Statement and Income statement.
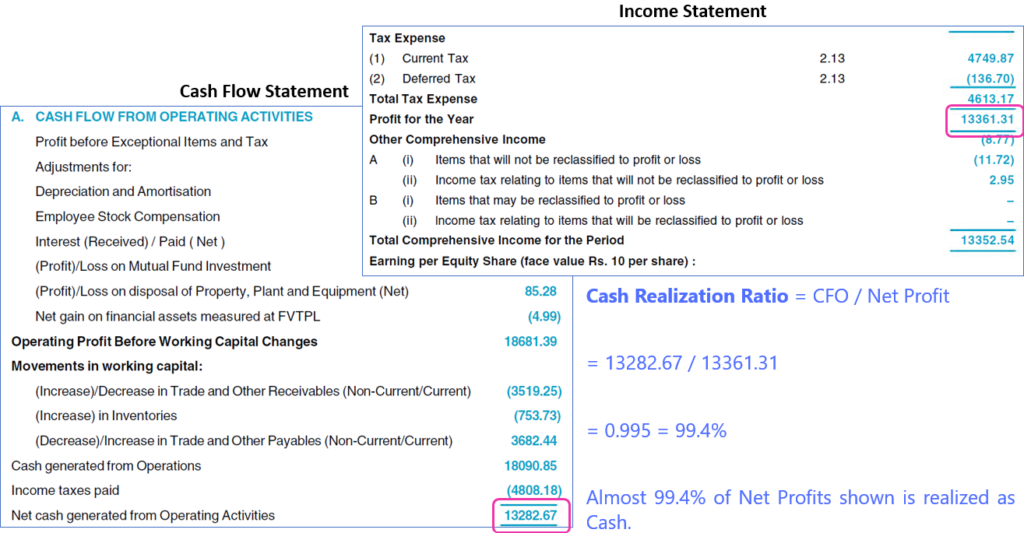
Cash Realization Ratio
What does this ratio do? This ratio measures the proportion of net profit reflected in actual cash generated from operations.
Formula: Cash from Operating Activities / Net Profit
Background: I came across this ratio and a deep explanation and importance in a book “Analytics to Detect Possible Fraud” by Pamela Mantone.
Inference
There are no benchmark values. In general, a higher ratio is generally considered favourable as it indicates a healthier cash flow generation relative to reported profits.
- A ratio greater than 1 suggests strong cash generation supporting reported profits.
- Conversely, a ratio less than 1 may indicate that the company’s reported profits are not fully supported by cash flow from operations, and raise concerns about earnings quality.
Additional Details
You might wonder if this ratio is needed in the first place. By seeing the values of Net Profit and CFO, one can determine which one exceeds. This is right. To get a meaningful inference, time series analysis must be done, where the ratio is monitored and evaluated for a few years i.e., 5 to 10 years. The favourable situation is that the ratio is constant over time and increase. When such analysis is done for different time periods, you will see that each year would have different Net Profit and CFO. Thus making year-on-year comparison difficult without this ratio.
Sample calculation
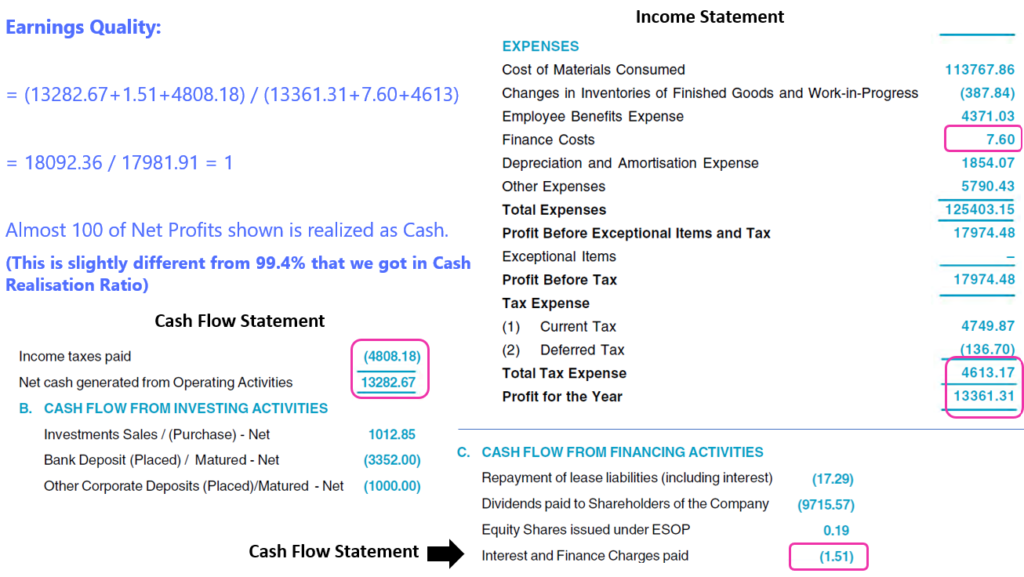
Earnings Quality
What does this ratio do? This ratio adjusts both the CFO and net income for the effects of interest and income taxes that result due to the difference between cash payments versus accruals and deferrals.
Formula = (CFO + Cash payments for interest and Income taxes) / (Net Income + Interest Expense + Income Tax Expense)
Inference
There are no specific benchmark values; however, a higher ratio is generally preferable. Monitoring the ratio over time reveals trends, with a ratio falling below 1 potentially signaling issues such as fictitious receivables or unrecorded payables.
Additional Details
This ratio serves as a more refined or alternative measure compared to the Cash Realization Ratio discussed previously. It offers a more realistic assessment of the disparity between operating cash flow (OCF) and reported earnings. This disparity arises because the profit and loss (P&L) statement reflects certain items, such as income tax, on an accrual or deferral basis. As highlighted in our earlier blog, while the P&L statement shows “Tax Expense,” the tax indicated in the cash flow statement represents the actual tax paid.
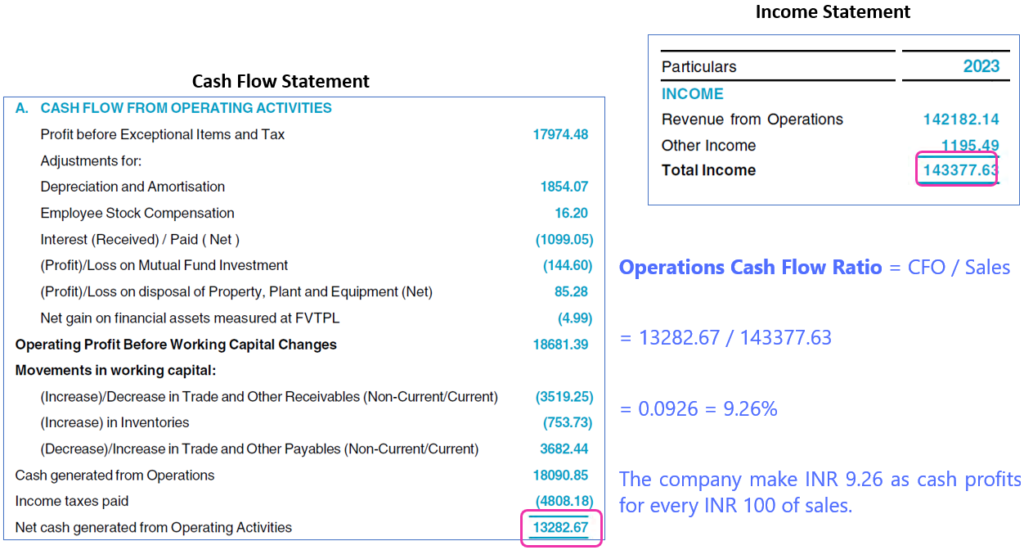
Cash Flow Margin Ratio
What does this ratio do? This ratio shows how much cash the company makes for every dollar of sales.
Formula: Cash Flow from Operations (CFO) /Sales
Inference
There are no benchmark values. The higher the percentage, the better as it is more profitable. This ratio also needs horizontal analysis to track historical performance and detect significant variances. The operating cash flow must increase in line with sales over time. They should not deviate from each other too much as it’s a sign of weakness and inconsistency.
This can be seen as equivalent to Net Profit Margin derived from the P&L statement. The difference being, in place of Net Profits, the value of CFO is used in the numerator.
FCF to Sales Ratio
What does this ratio do? This shows the number of sales converted to FCF. This ratio will show you how profitable the company is in generating excess cash. This ratio can be seen as an alternative to the above ratio where FCF is used in the numerator instead of Operating Cash Flow.
Formula: FCF / Sales
Inference
FCF/Sales expressed as a percentage is often used to find ‘cash cow’ stocks. When screening the market it’s good to look for a FCF/Sales ratio that is greater than around 5% – that’s often a sign of a high-quality company. (Reference: Free cash flow to Sales.)
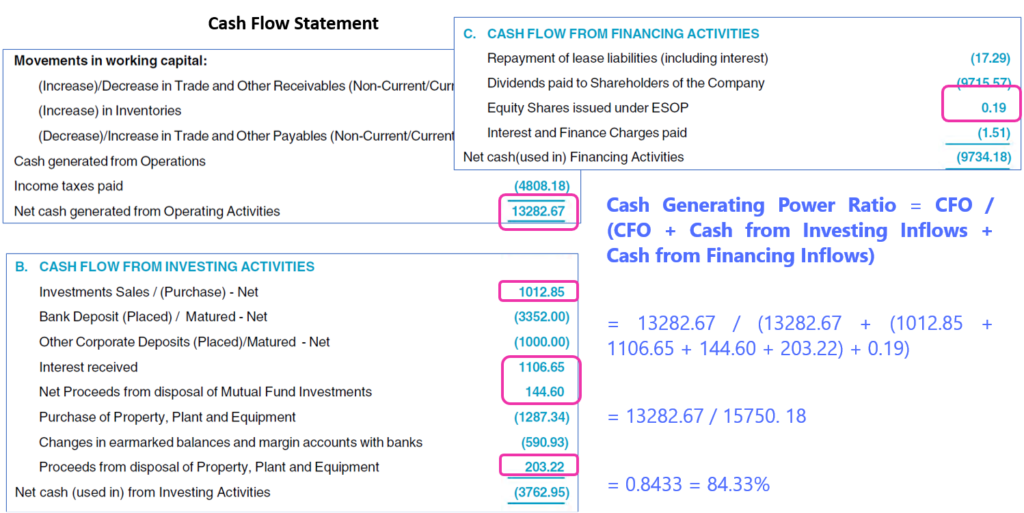
Cash Generating Power Ratio
What does this ratio do? This ratio shows the company’s ability to generate cash purely from operations compared to the total cash inflow.
Formula: CFO / (CFO + Cash from Investing Inflows + Cash from Financing Inflows)
Inference
The Cash Generating Power Ratio always remains below one and cannot exceed this value. No specific benchmark values exist for this ratio. Investors should assess a company’s Cash Generating Power Ratio annually and compare values across different periods. A decreasing trend in this ratio over time warrants attention and may indicate potential concerns.
Additional Details
It’s noteworthy that the denominator of this ratio includes only the inflows from cash flow from investing activities and cash flow from financing activities. This adjustment provides a unique perspective on a company’s cash generation capability. I first encountered this ratio in an article by Jae Jun, where he highlighted it as his preferred metric.
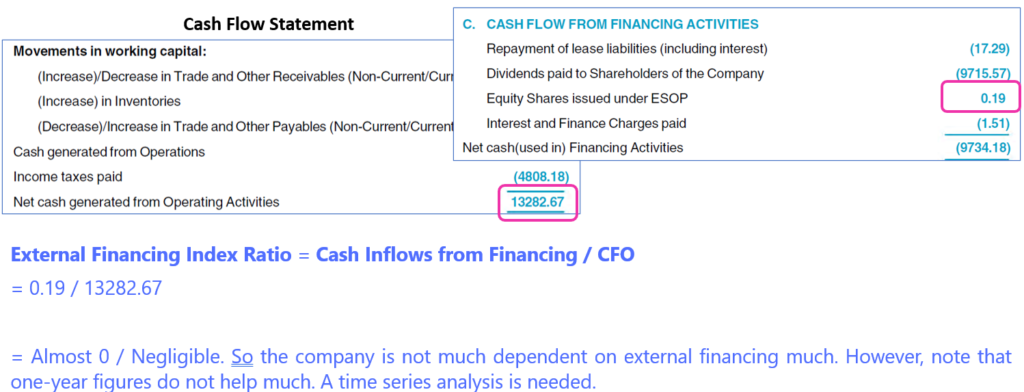
External Financing Index Ratio
What does this ratio do? This ratio compares the cash flow from financing activities with cash from operation to show how dependent the company is on financing.
Formula: Cash inflows from Financing / CFO
Inference
There are no benchmark figures. The higher the number, the more dependent the business is on external money. Lower value of this ratio is preferable for investors.
Additional Details
It’s noteworthy that the denominator of this ratio includes only the inflows from cash flow from investing activities and cash flow from financing activities. This adjustment provides a unique perspective on a company’s cash generation capability. I first encountered this ratio in an article by Jae Jun, where he highlighted it as his preferred metric.
Conclusion
The cash flow ratios provide investors with a powerful toolkit for evaluating a company’s financial performance and stability. Each of the six ratios discussed in this blog offers unique perspectives on different aspects of cash flow management, ranging from the conversion of profits into cash to the company’s reliance on external financing. You may not get these insights by merely analysing the Balance Sheet and Income Statement.
Hope you found this blog useful. Do share my blogs with your friends, peers and fellow investors.