

Welcome back to the continuation of our exploration into cash flow ratios. In the previous blog, we examined six key cash flow ratios, shedding light on aspects such as cash realization, operating cash flow, earnings quality, free cash flow to sales, cash generating power, and external financing index.
Now, we continue our exploration by delving into eight additional cash flow ratios that provide deeper insights into a company’s liquidity position and valuation. The focus of this blog largely revolves around comparing figures from the cash flow statement with those from the balance sheet or stock price, offering valuable metrics for investors and analysts alike. It is to be noted that the previous blog compared figures from the cash flow statement itself and with the Income statement.
Featured image credit: Image from internet.
Dear Reader,
This blog is part of a larger series. For a comprehensive understanding of this blog, we recommend reading the previous blogs.
The cash flow ratios discussed in this blog use numbers from Balance Sheet and Stock prices.
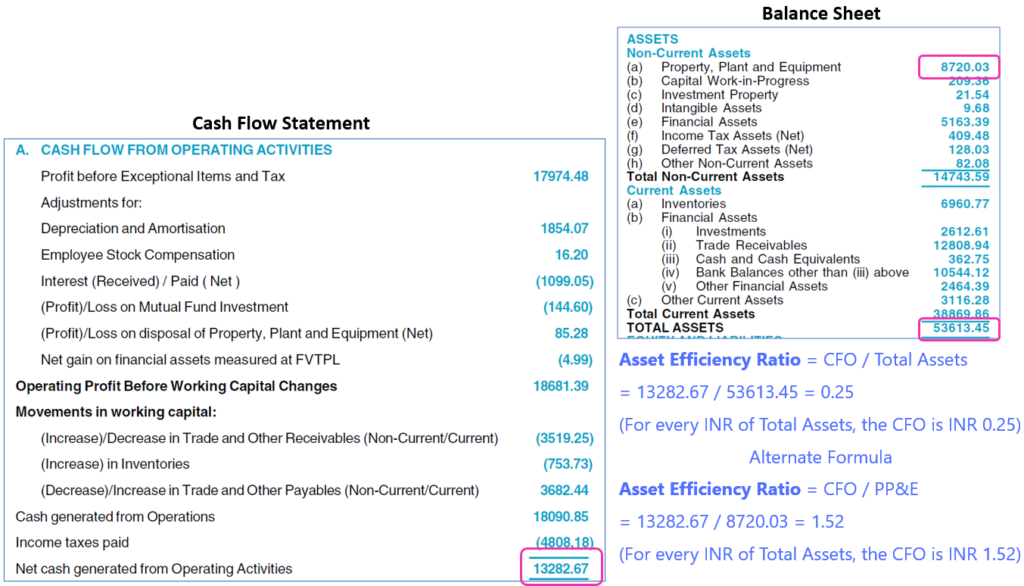
Asset Efficiency Ratio
What does this ratio do?
This ratio shows how well the company uses its assets to generate cash flow.
Formula: CFO / Total Assets
Inference
This ratio resembles ROA but replaces net income in the numerator with cash flow from operations. Investors derive insights by examining historical patterns and conducting comparisons with industry peers.
Additional Details
An alternative approach involves using PP&E instead of total assets for calculation, which offers a more accurate representation as it excludes cash and working capital, focusing solely on assets involved in operating cash flow.
Alternative Formula: CFO / PP&E
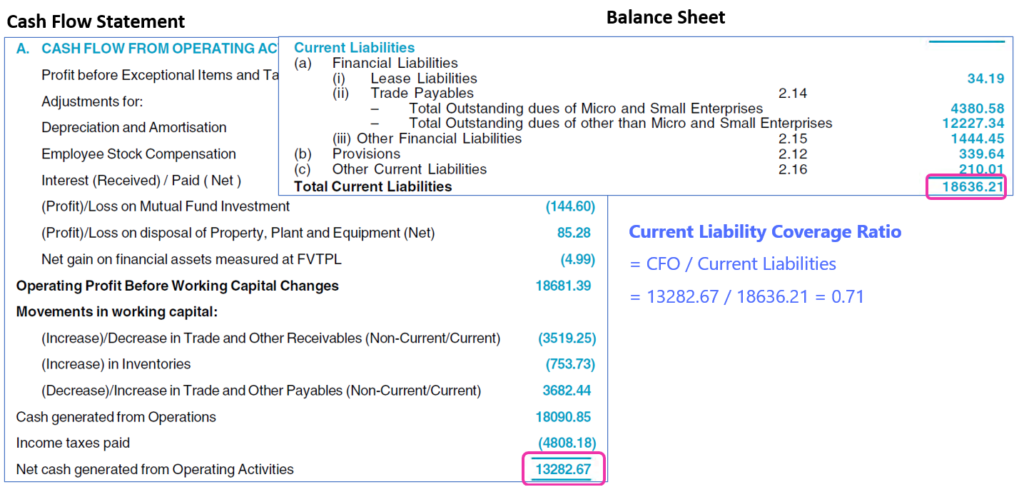
Current Liability Coverage Ratio
What does this ratio do? This ratio indicates the ability of the company to pay off short term obligations which are due within one year.
Formula: CFO / Current Liabilities
Inference
This ratio is used to analyze the short-term stability of a company. It is a better indicator of the company’s ability to pay current liabilities than the traditional current ratio or quick ratio. The current liabilities include the current maturing portion of long term debt.
A value of 2 means that the current cash flows can pay for 2x the current liabilities. The higher the number the better. If it drops below 1, then the CFO is unable to pay the current liabilities and need to borrow further to pay the current liabilities.
Additional Details
When the company pays dividends, adjusting the numerator by subtracting dividends paid from the CFO offers a more accurate depiction of its liquidity position. In this scenario, the numerator becomes (CFO – Dividends Paid). This adjustment ensures that cash outflows associated with dividends are duly accounted for, thereby furnishing investors with a clearer understanding of the company’s ability to manage its short-term financial commitments while also distributing profits to shareholders.
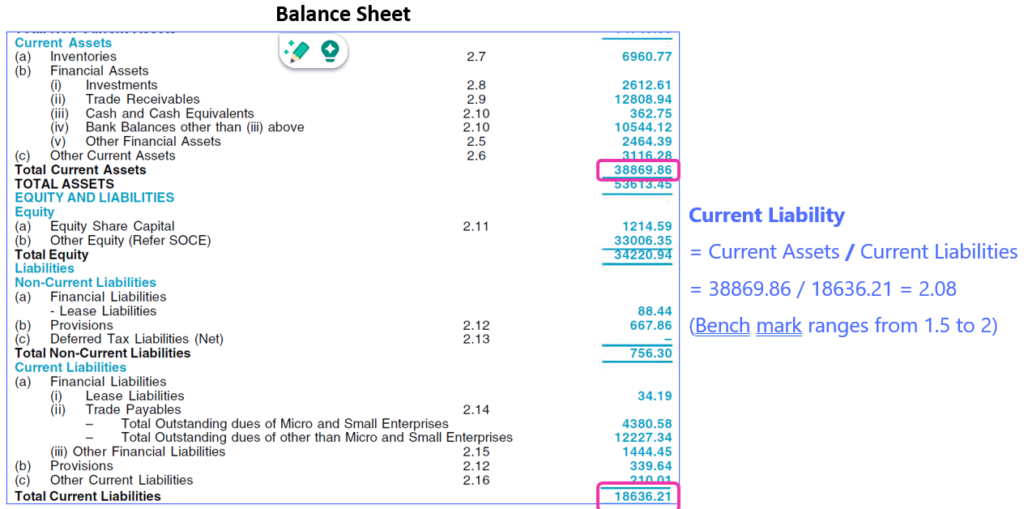
Just bringing a interesting observation. While the traditional measure of liquidity typically relies on the Current Ratio, which in this case surpasses benchmarks, a different picture emerges when considering the Current Liability Coverage Ratio. Here, it becomes evident that the CFO falls short of adequately covering the payment for current liabilities. Below, you’ll find the calculation for the Current Ratio.
Long Term Debt Coverage Ratio
What does this ratio do? This ratio indicates the ability of the company to pay off its long term debt from its CFO.
Formula: CFO / Long Term Debt (or) (CFO – Dividends Paid) / Long Term Debt
Inference
This ratio measures the solvency of a company by indicating the time it would take to pay back debts assuming:
- No new long term debts are incurred
- The CFO is used only to repay debts and remains constant in the coming years.
If this Ratio is 4, it indicates that the company would take 4 years to pay off its long-term debt from current level of CFO.
Interest Coverage Ratio
What does this ratio do? This ratio will show you the company’s ability to make the interest payments on its entire debt load.
Formula: (CFO + Interest Paid + Taxes Paid) / Interest Paid
Inference
- A highly leveraged company will have a low multiple.
- A company with a strong balance sheet will have a high multiple.
- If the interest coverage is less than 1, the company has a high risk of default.
Cash Return on Invested Capital (CROIC)
What does this ratio do? This ratio measures how much cash a company can make for every amount invested into its operations.
Formula: CROIC = FCF / Invested Capital
Where Invested Capital = Shareholders Equity + Interest Bearing Debt + Short Term Debt + Long Term Debt
Inference
CROIC exhibits variability over time and doesn’t remain constant. Consistently surpassing a CROIC of 13% indicates a competitive advantage, suggesting positive free cash flow and strong industry performance. (Reference: My Top 10 Stock Valuation Ratios
Price to Cash Flow Ratio
What does this ratio do? It is a valuation ratio that gives the price multiple of the CFO generated by the company.
Formula: Current Market Price / CFO
Inference
This is very similar to P/E ratio, except that the denominator has the CFO instead of Net Profit. Lower value is better indicating lower valuation.
FCF Yield
What does this ratio do? This ratio compares the FCF of the company against its market value.
Formula: FCF/Market Cap
Inference
Lower the ratio, the less attractive a company is as an investment because it means investors are putting money into the company but not receiving a very good return in exchange. A high free cash flow yield result means a company is generating enough cash to easily satisfy its debt and other obligations, including dividend payouts. (Reference: https://www.investopedia.com/terms/f/freecashflowyield.asp)
FCF / OCF Ratio
What does this ratio do? This ratio measures the amount of free cash flow (FCF) for every rupee of operating cash flow generated by the company.
Formula: FCF / OCF
Inference
The higher the ratio the better. A higher FCF ratio means greater cash flow flexibility and a higher potential for value creation. This ratio cannot be meaningfully used if either of the numbers is negative. Thus, this ratio finds utility only in mature companies where both these values are positive.
Additional Information
Both OCF and FCF ratios can provide useful insights into the cash flow performance of a company, but they have different focuses and limitations.
- The OCF ratio focuses on the short-term liquidity and solvency of a company, while the FCF ratio focuses on the long-term profitability and sustainability of a company.
- The OCF ratio does not account for the cash needed to maintain or expand the productive capacity of a company, while the FCF ratio does not account for the cash needed to meet the current obligations of a company.
This ratio helps to compare both values and understand the trade-offs between them. (Reference: https://www.linkedin.com/advice/0/how-do-you-communicate-implications-ocf-ratio)
Note: There are no examples for some ratios in this blog. The same shall be done in the actual study of Cash Flow Statement in future blogs.
Conclusion
We have explored a total of 14 cash flow ratios, with 8 discussed in this blog and 6 in the previous one. Examining these ratios collectively allows investors to glean comprehensive insights into cash flow management, liquidity, profitability, and sustainability.
However, it’s imperative not to rely solely on cash flow ratios in isolation. They should be correlated with other financial metrics to obtain a holistic understanding of the company’s financial position.
Hope you found this blog useful. Do share my blogs with your friends, peers and fellow investors.