

In the realm of finance, figures often conceal valuable insights just waiting to be revealed. Among these, revenue stands out as a particularly rich source of information, akin to a goldmine for investors seeking strategic foresight. Through this blog, we’ll delve into the depths of revenue analysis, uncovering its true potential and the wealth of knowledge it offers to investors.
Featured image credits: https://www.forbes.com/sites/melissahouston/2023/08/01/how-to-supercharge-your-business-profits-and-generate-more-revenue/?sh=3de305012116
Hi, This is Venkatesh. I write on Personal Finance, Stock Investing, Productivity and Time Management. You will be interested to read more about me and the purpose of my website.
If you are interested in these topics do subscribe to my blogs. You would maximum receive 4 to 5 emails a month. Do check my Blog Index for all my blogs.
You might want to explore my other blogs that also delve deeply into the analysis of financial statements like Debt Equity Ratio and Metrics for Dividend Analysis (Part 1 and Part 2)
What is Revenue?
- Revenue is the lifeblood of any business – it’s the money a company brings in from selling its products or services.
- It can be calculated by the formula: Number of units sold x Price per unit. However, real scenarios are not always straightforward as in this equation.
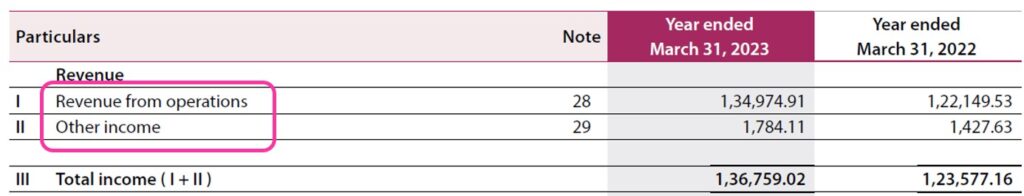
- Revenue is often mistaken as profit. It is not correct. Profit is what remains with the company after deducting all direct and indirect expenses from revenue.
- It is also referred to as the “Top line” because it’s the first figure listed in the Profit and Loss (P&L) statement.
- It is a very powerful number as it occupies the denominator in all profitability ratios like Net Profit Margin, EBIT, EBITDA, Operation Margin etc.
- It is the only value that cannot be negative in the Profit and Loss (P&L) statement.
Types of Revenue
It can be categorized into two main types:
Core Revenue
This revenue comes from the company’s primary operations or core business activities.
Non Core Revenue
This encompasses income generated from activities outside the company’s primary operations, such as the sale of assets land, or interest earned from deposits.
Both these details are available from the Income statement as shown in the sample below.
Source of Data
When delving into revenue analysis, where can you find the necessary data?
The primary sources are
- Profit and Loss statement in the annual report
- Financial websites like Screener and MoneyControl
My preference is to use the numbers in annual reports along with the notes accompanying them. Annual reports also give a detailed breakdown of revenue streams in terms of geographies, business verticals, import exports.
Took Kit for Revenue Analysis
Revenue serves as a fundamental metric for analyzing a company’s financial health and performance. It forms the basis for calculating many profitability ratios and occupies the denominator in those calculations. Let us see the different tool kits available for Analysis.
10-Year Revenue Analysis
Analyzing over a decade offers valuable insights into a company’s growth path. There are four methods to approach this analysis. Three of them are quantitative and one is qualitative analysis.
Compound Annual Growth Rate (CAGR)
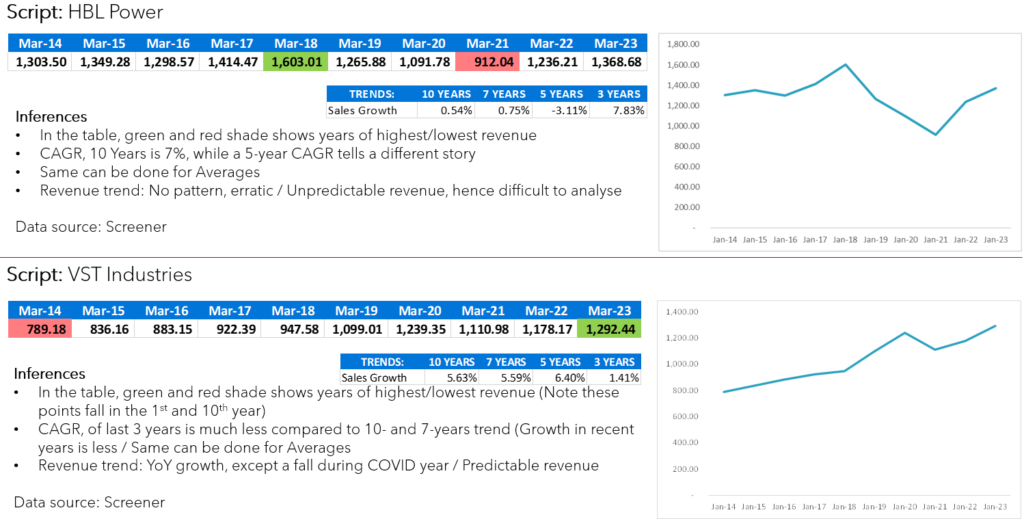
CAGR is a common metric used to estimate a company’s growth over 5 or 10 years. However, it should be interpreted cautiously, as outliers in one or two years can distort the results. To get a clearer picture, it’s beneficial to compare the 10-year CAGR with shorter periods like 5 or 3 years. Such an approach often gives a different story and a more accurate picture of the growth.
Averages
The average revenue over 10 years gives a sense of Revenue as a single number. But similar to CAGR, averages can be misleading. To mitigate this, it’s helpful to calculate averages for shorter periods, such as the recent 3 or 5 years, and compare them with the 10-year average.
The idea of comparing long and short term averages (or CAGR) has its root from Chapter 14 of the book “Intelligent Investor”. Graham recommends, “A minimum increase of at least one-third in per-share earnings in the past ten years using three-year averages at the beginning and end.”
Trends
Visualizing 10-year data in a bar or line chart helps identify patterns, whether they’re cyclic or long-term. This approach provides a more intuitive understanding of fluctuations, peaks, and troughs.
I will demonstrate these three methods using two contrasting examples for better understanding.
Please note that the stock names mentioned are for illustrative purposes only and NOT recommendations for buying or selling. If you make investment decisions based on this blog and experience losses, please take responsibility for your actions instead of blaming me or my blog.
There is also a fourth tool, which I use when the story gets interesting and really worth the time to dig more.
Exploring Highs & Lows
Another insightful analysis to consider when examining 10-year financial statements is reasoning high and low revenue periods. Unlike quantitative analysis, this approach leans towards qualitative examination. You delve into the causes behind both the highest and lowest values observed throughout the 10-year period, which serve as indicators of the company’s peak and low points in performance.
It’s important to understand that there’s always a reason behind a company achieving its highest or lowest revenue. This analysis delves into uncovering these reasons, which can often be found in sections like “Management Discussion and Analysis” or initial notes by the company’s promoters or “Performance Review Section”. This investigation helps decipher whether the reasons are inherent to the company itself, influenced by industry trends, or indicative of changing consumption patterns.
Below is a sample of such an Analysis.
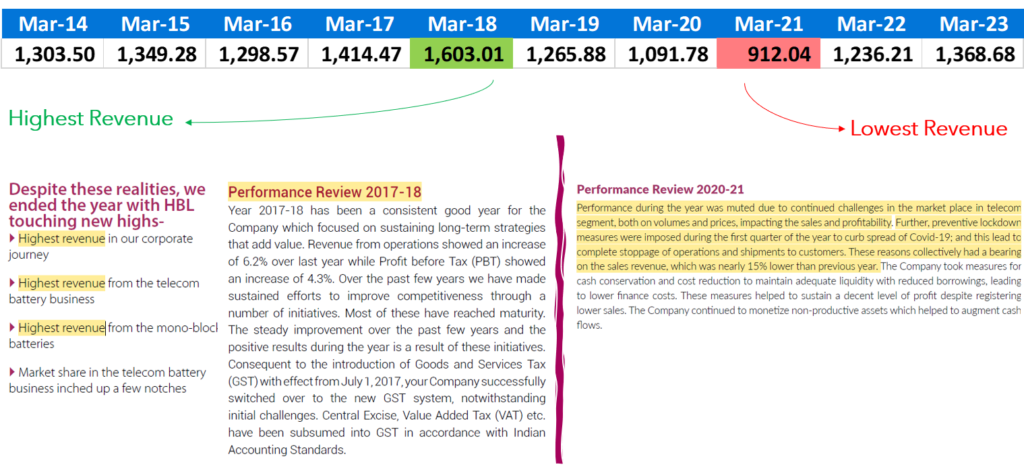
While this analysis isn’t necessary for every company, it becomes valuable when assessing investment opportunities or seeking deeper insights before making a decision.
Revenue Per Employee
This is arrived at by dividing the total revenue by the number of employees in the company. The details of the number of employees are published in the annual report. This can shed light on operational efficiency.
It’s not just a random number; it can give us insights into how efficiently a company operates. But looking at this figure alone doesn’t tell us much. We can get more value from the analysis by comparing it in two ways:
10 Year Revenue/Employee trend
By examining this metric over 10 years, we can spot trends in operating efficiency. Is the company getting better at making money with fewer employees?
Comparision with Competitors
Comparing this metric with similar companies tells us how efficient our company is compared to others in the industry. Are they making more revenue per employee than their competitors?
Revenue Breakup Analysis
This involves dissecting revenue by factors like imports versus exports, various product lines, or geographical regions. This analysis offers strategic insights, highlighting the products or regions generating the highest revenue. Examining 10 years of data provides deeper insights, showing trends in imports/exports or specific products/regions over time.
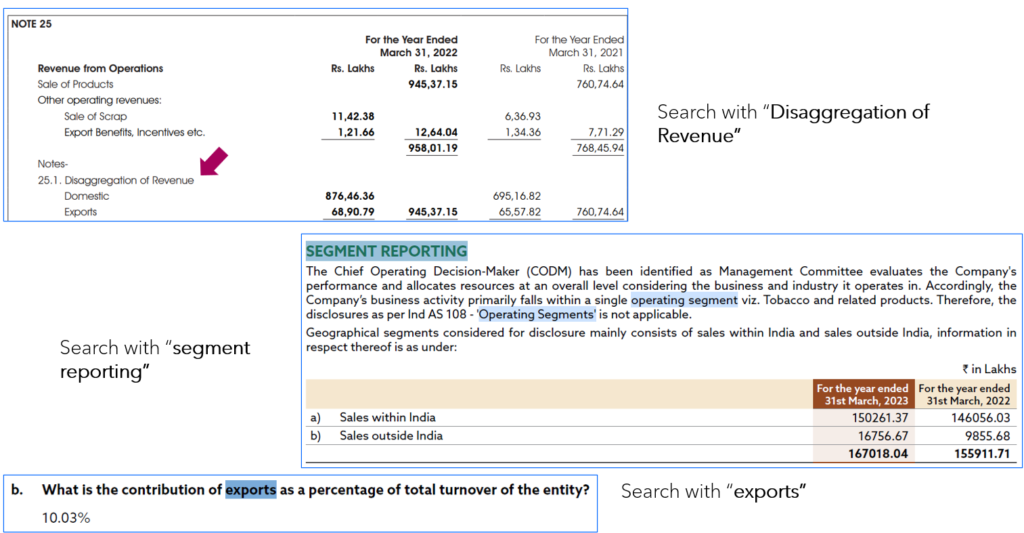
For example, in the following illustration, you’ll find revenue from different products as well as the breakdown of exports and domestic sales. Converting 10 years of data into percentages relative to total revenue can provide insights into trends such as increasing/declining exports or increasing/declining battery sales.
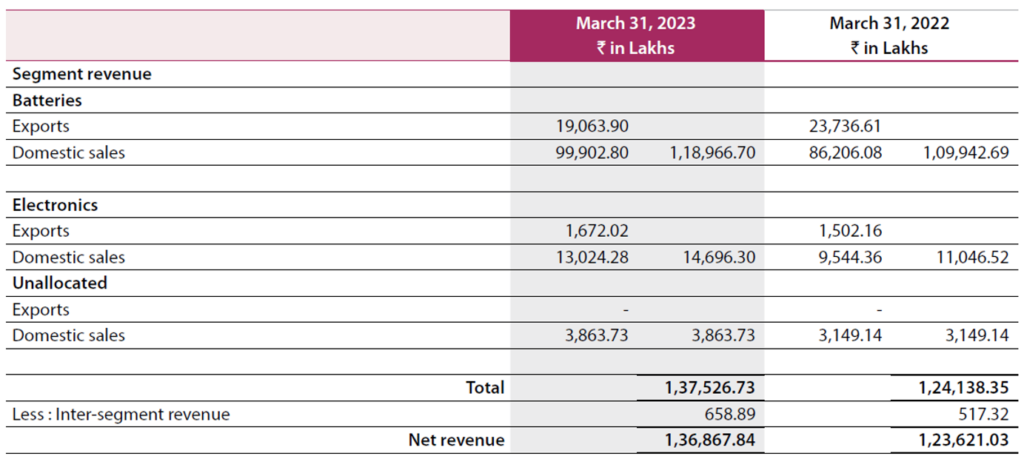
How to get this break up? In the annual report, look for keywords like
- Segment Revenue
- Segment wise revenue
- Segment reporting
- Export
- Operating segments
- Disaggregation of Revenue
A few samples are shown below:
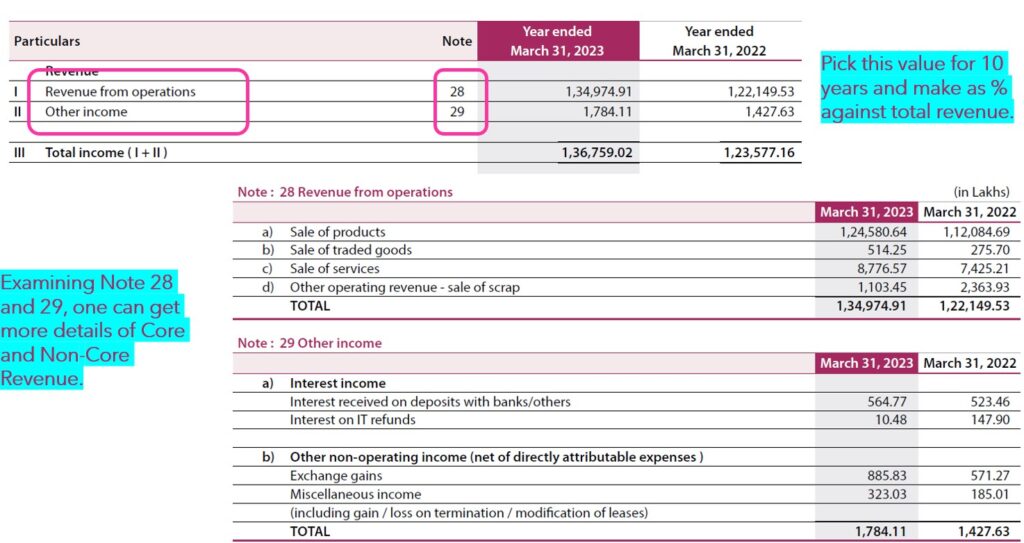
Core / Non Core %
This metric indicates the proportion of revenue derived from core business operations. It calculates the ratio of non-core revenue to total revenue. Ideally, a significant portion of revenue should stem from core activities. However, if non-core revenue outweighs core revenue, it warrants further investigation.
Examining the year-on-year trend can unveil any uptick in non-core revenue. If such an increase occurs, investors may want to delve deeper into the reasons behind it. The notes accompanying the financial statements often shed light on the factors contributing to the rise in non-core revenues.
Investors also can gather more insights about the Core / Non Core values by referring the accompanying notes. Sample shown below.
Conclusion
It is abundantly clear that beneath the surface of financial statements lies a wealth of strategic insights waiting to be harnessed. The tools discussed are powerful ones for investors seeking to understand a company’s financial performance and prospects. By examining various aspects of revenue data and trends, investors can make more informed decisions and gain deeper insights into the companies they’re interested in. So next time you see a number and financial, remember – there’s a whole story behind those digits!
Hope you found this blog useful. Do share my blogs with your friends, peers and fellow investors.