In the last blog, we saw that there are 6 tools used for Royalty Analysis. We also saw in detail two of the tools (Royalty details and Royalty amount). This blog will cover the remaining four tools for Royalty Analysis. (Featured image: Oracle Headquarters)
To better understand this blog, you need to read my three earlier blogs on MNC companies that cover:
- Overview of MNC Companies, their unique traits and premium valuation
- Royalty payments to overseas parents, investor concerns and views of the investment community
- Tools to Analyze Royalty – Part 1
All the details needed for this analysis come from the Annual report. From the previes blog, you now know how to identify royalty details. The royalty amount does not give much interpretation. Is it less or more? To gain meaningful inference the royalty should be compared with other figures in the financial statement. It can be compared with:
- Expenses
- Revenue
- Dividend
- Debt
This comparison forms the remaining four tools.
Hi, This is Venkatesh. I write on Personal Finance, Stock Investing, Productivity and Time Management. You will be interested to read more about me and the purpose of my website.
If you are interested in these topics do subscribe to my blogs. You would maximum receive 4 to 5 emails a month.
You might also be interested to read these related articles:
Royalty Vs Total expenses
This analyses what % of total expenses are spent on royalty. Total expense is available in the P&L statement while royalty can be found from the methods discussed in my previous blog. The numerator has the royalty paid and the denominator has the total expenses.
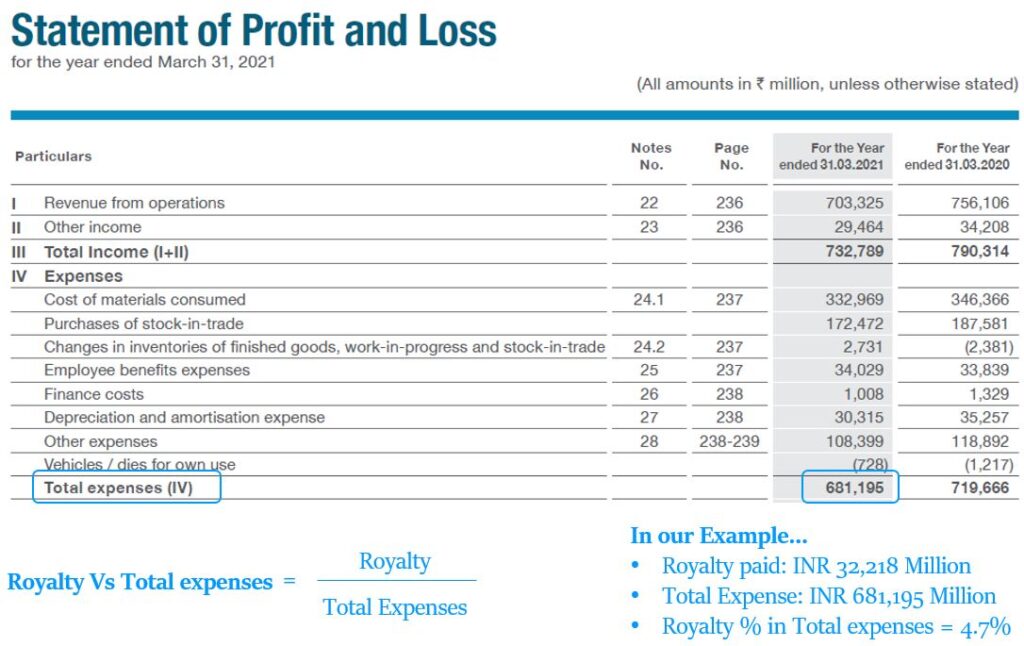
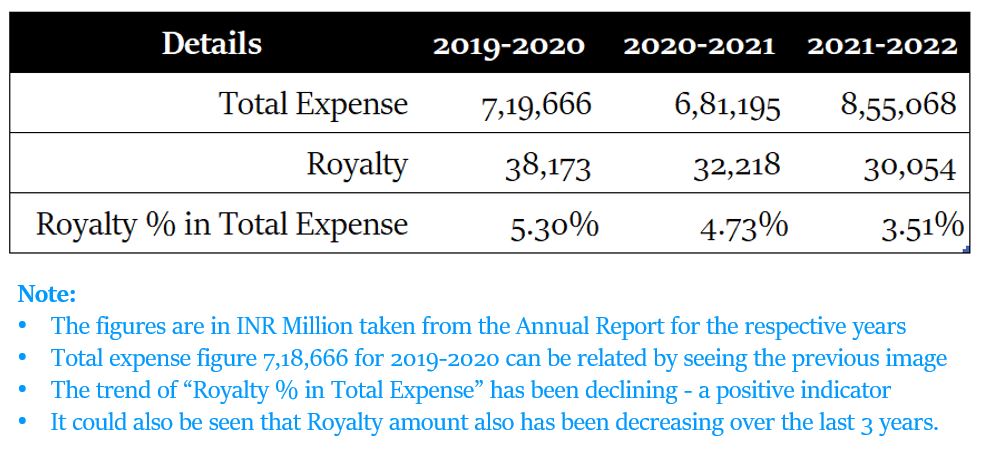
The extended analysis involves analysing this metric for the last few years. This trend gives more insights than the standalone value.
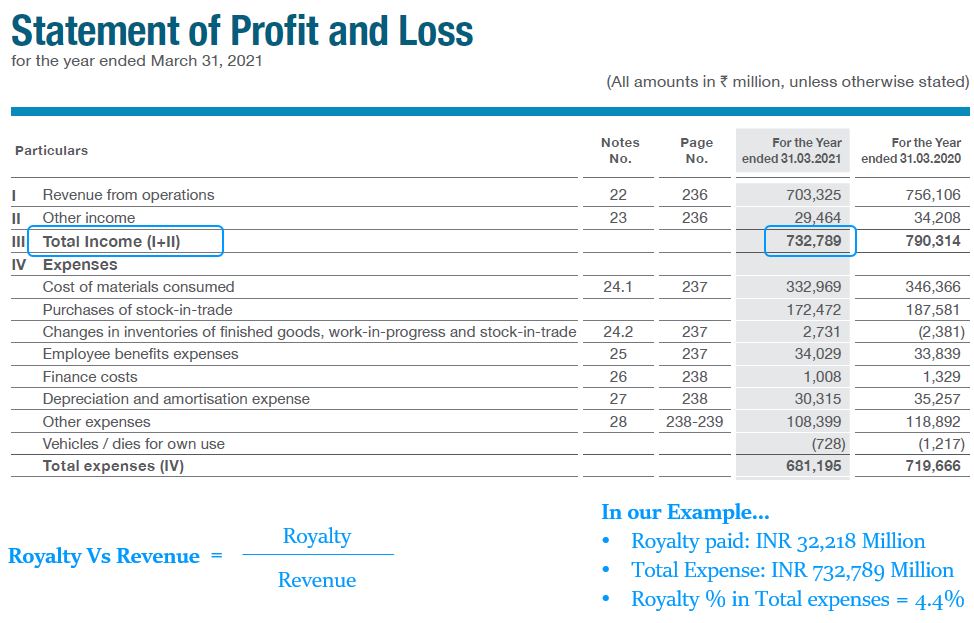
Royalty Vs Revenue
This analyses the % of royalty paid on the revenue. The revenue is available in the P&L statement. The numerator has the royalty paid and the denominator has the revenue.
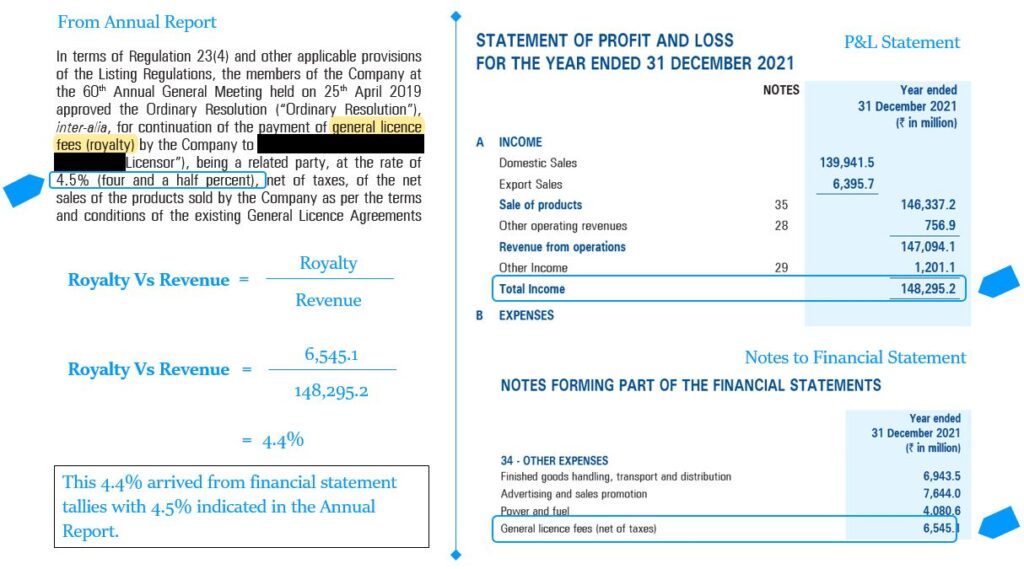
Sometimes, this detail is shared by the company as below. The company would pay 4.5% of revenue as Royalty. You could verify this using this analysis. In the sample below, it works out to 4.43%, which aligns with the policy.
The extended analysis as in the previous example to analyse this ratio for the last few years gives more insights.
Note: Most companies adopt this formulation for royalty payment. Royalty is paid as a certain %-age of revenue.
Royalty Vs Dividend
To do this analysis, you need to be clear on how these two pay-outs:
- Dividend is paid out to all stakeholders, which involves minority shareholders as well as promoters
- Royalty is paid only to the overseas parent.
This analysis compares the dividend payout with the royalty. This comparison can be made at two levels.
Royalty Vs Total Dividends
The royalty is compared with the total dividend paid to all stakeholders of the company. The stakeholder includes the minority shareholders and overseas parents. The details of the total dividend paid can be had from the Cash flow from Investing activities (In the Cash Flow Statement). The image below illustrates it.
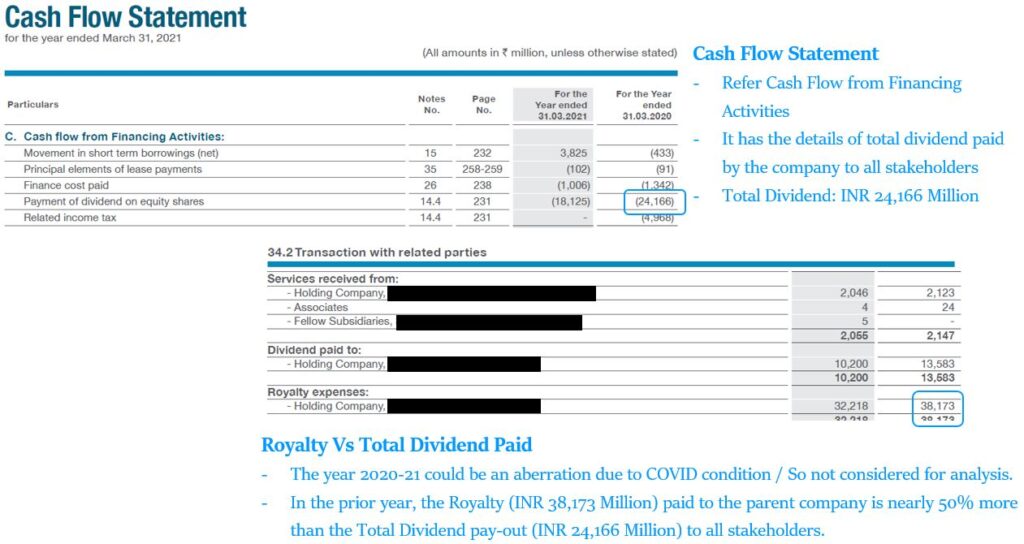
One inference that you need to look for:
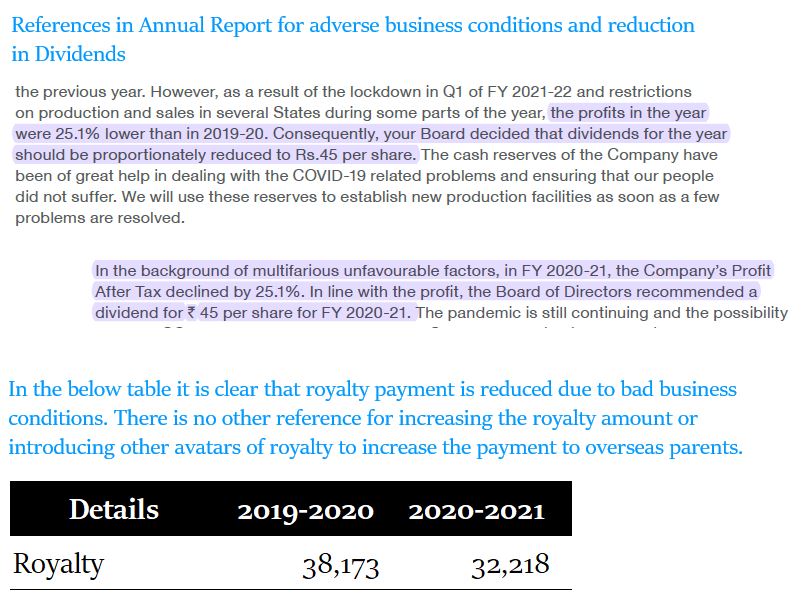
- During difficult business conditions, management cut down dividends. Royalty also reduces since it is %-age of revenue, which reduces in bad business conditions.
- But did the parent company increase the royalty %-age that year to retain their pie of royalty?
- Were there any new “avatars” of royalty component added/increased to facilitate more payment to overseas parents?
If Yes, then there is an important message on corporate governance. Different yardsticks for the same scenario of bad business conditions:
- Dividends cut down for minority shareholders.
- Parent company used alternative means to retain/increase their royalty pay-out
In the sample below, both the dividends and royalty were reduced followed by tough business conditions.
Royalty Vs Dividends received by overseas parent
The royalty is compared with the dividend paid to the overseas promoter group. Both these details are available in the “Details of Related Party Transactions” section. This gives insight into the size of the royalty and dividend received by the overseas promoter. Which is bigger? Dividend or royalty. This helps to understand, which is the bigger incentive for overseas parent. Sample below.
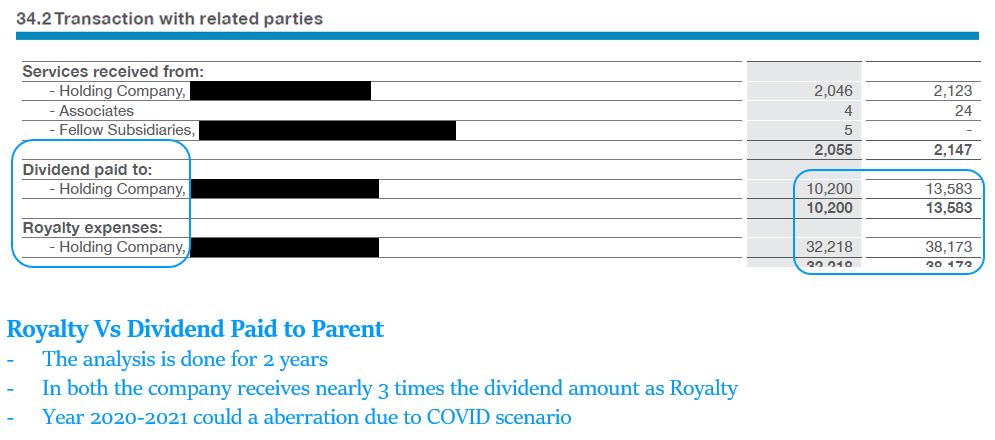
Did you find something peculiar?
Was royalty greater than Dividends?
In most cases, royalty is substantially higher than dividends. This is due to:
- Royalty is calculated as a %-age on the total revenue figures, while
- Dividends are calculated as a %-age on total profits, which again is some %-age of revenue
You can realize how the idea of royalty payment is skewed in the favour of promoters. By taking a %-age of revenue, they get a fixed amount as royalty, even if the business incurs a loss. When the company makes losses, dividends are not declared. Which is an impact on minority shareholders. Though promoters also do not get their share of dividends, they have already extracted a lion’s share in the form of royalty!
Royalty Vs Debt
Compare the royalty paid vs the debt. The value of debt can be seen in the liabilities section of the balance sheet. If the debt is higher (say 2 or more times) than royalty, ask yourself. Could not the promoter reduce (or forego) their royalty for 2 years, to make the company debt free? It would also reduce the interest outgo.
The promoter taking royalty though the company is reeling in debt, may not be a positive sign. In this scenario, nothing is wrong. The royalty payment despite the company being in debt is legally right. You get pointers on the intention, mindset of overseas promoters and message on corporate governance.
How big is the impact?
It is not possible to answer if the royalty payment is high or low. Literature gives benchmarks for various financial ratios like current ratio, debt-equity ratio etc. However, there are no such benchmarks for royalty payment.
Investors need to realise that royalty pay-out hits the profit of the company. This impacts the dividends to shareholders and/or investment in growth. To understand the impact of royalty on investors, let us see alternate history. Consider a hypothetical situation of zero royalty.
We will take the case of the company paying INR 32,218 million as royalty. If suppose this royalty is not paid, then the amount INR 32,218 million is not an expense to the company. What could the outcomes be?
- Increased profits: This INR 32,218 million is not an expense and improves the bottom line. This higher profit can be given to shareholders as dividends or used for future growth. The benefit accrues to both overseas promoters and minority shareholders.
Note: The same INR 32,218 million may not get added to the profits. This is because the additional INR 32,218 million when it comes to the bottom line will invite additional taxes. However, the overall profit of the company improves.
- Premium valuation: Lesser expenses lead to better profitability ratios i.e. Gross Margin, Net Profit Margin, RoE etc, of the company which leads to premium valuation. This benefits all the shareholders.
- Lower product pricing: The company could use a different strategy. Since this expense of INR 32,218 million is not incurred the company can reduce the product pricing for better competitiveness.
These are a few random high-level outcomes. But there could be many more possibilities which are in the best interest of all stakeholders.
What is next?
This ends our discussion on royalty. The next topic is on another important corporate governance i.e., Related Party Transaction. However, to understand it better you need to understand, (1) The holding structure of the promoter group, (2) The relation between the Indian listed entity, its subsidiary and other subsidiaries of the parent. We will cover both of these topics in the next blog.
Hope you found this blog useful. Do share my blogs with your friends, peers and fellow investors.

