

Welcome to an applied exploration of cash flow analysis using a live example from a cash flow statement. In this blog, we’ll explore how to use cash flow ratios to glean insights into a company’s financial performance. Building on our previous discussion about decoding cash flow statements and drawing inferences, this blog continues the conversation by delving deeper into cash flow ratios.
(Featured image credits: https://drivecreativeagency.com/how-to-create-and-use-case-studies-that-help-you-sell/)
Dear Reader,
This blog is part of a larger series. For a comprehensive understanding of this blog, we recommend reading the previous blogs.
- Introduction to Cash Flow Analysis
- Cash Flow from Operating Activities
- Cash Flow Ratios, Part 1 (Must read to understand this blog better)
- High Level Cash Flow Analysis
- Cash flow from Investing Activities
- Cash flow from Financing Activities
- Cash Flow Ratios, Part 2 (Must read to understand this blog better)
- Decode Cash Flow Statements with a case study
Analysis of Cash Flow Ratios
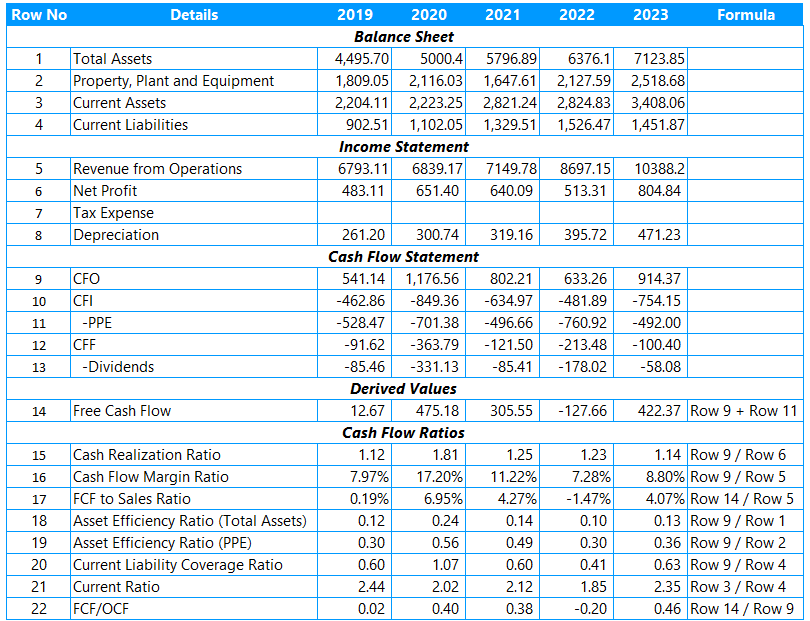
The single image below encapsulates the essence of the entire blog and contains all the necessary details. I have annotated row numbers for clarity and will discuss the associated concepts. The cash flow ratios are depicted in Rows 15 to 22, with the formulas used to arrive at these ratios shown in the last column. However, several ratios listed below are not covered in this analysis:
- Cash Generating Power Ratio
- External Financing Index Ratio
- Long Term Debt Coverage Ratio
- Interest Coverage Ratio
The reason for their omission is that they are not applicable in this case. For instance, if the company has no long-term borrowings or has not raised any new external funds in the current year, it is not feasible to calculate these ratios.
While the above image is more than sufficient to demonstrate this blog, a few fine nuances are listed below.
Cash Flow Margin Ratio
Referring to Row 16, this ratio can be viewed as the equivalent of the Net Profit Ratio. How can we interpret this ratio? For instance, in the year 2023, the value is 8.80%, indicating that for every 100 rupees of revenue, the company can generate 8.80 rupees as cash profits.
Asset Efficiency Ratio
Referring to rows 18 and 19, while academics might use Total assets in the denominator, a more realistic picture emerges when PPE is used instead. This is because PPE are directly involved in producing the company’s goods (or services).
Current Liability Coverage Ratio
Referring to Row 20, this ratio measures how much of the CFO can cover the current liabilities. Ideally, a value above 1 is preferable, indicating that the CFO is sufficient to cover the entire current liabilities. However, in this case, it can be observed that it was less than 1 in 4 out of the 5 years. While this may not raise immediate concerns, it highlights that the CFO is insufficient to cover the current liabilities.
This ratio underscores an important learning point. Now, comparing this with the Current Ratio in Row 21, where a value of 1.5 to 2 is considered healthy and indicates that the company would have no difficulty honoring its current liabilities. This inference contrasts with what we observe from the Current Liability Coverage ratio.
Conclusion
This blog has demonstrated the practical application of cash flow ratios using a real-world example. Understanding and applying cash flow ratios is essential for making informed investment decisions.
Hope you found this blog useful. Do share my blogs with your friends, peers and fellow investors.