

Welcome to a detailed exploration of cash flow analysis using a real example of a Cash Flow statement extracted from annual reports. The cash flow statement is a critical financial document that provides insights into a company’s liquidity, operational efficiency, and financial health. By dissecting the components of the cash flow statement and interpreting their implications, investors and analysts can gain a deeper understanding of a company’s performance and strategic priorities.
In this blog, we’ll examine key sections of the cash flow statement and demonstrate how to extract valuable insights from these numbers. For the fullest understanding of this blog, please read to all the previous blogs on this topic.
(Featured image credits: https://drivecreativeagency.com/how-to-create-and-use-case-studies-that-help-you-sell/)
Dear Reader,
This blog is part of a larger series. For a comprehensive understanding of this blog, we recommend reading the previous blogs.
High Level Analysis of Cash Flow Statement
In the previous blog, we explored this approach, which involves drawing high-level inferences based solely on the positive or negative values of CFO, CFI, and CFF. This preliminary analysis serves as a starting point before delving into finer details.
This particular case corresponds to CFO+ CFI- CFF-, as discussed in section 3.2 of the previous blog. The interpretation of this scenario is as follows:
- Strong operating cash flows
- Potential use of operating cash flow for CapEx, Reward shareholders, or debt repayment
However, these inferences are preliminary and require further validation through detailed numerical analysis.
Deep dive Analysis of Cash Flow Statement
Now after the high level analysis we move to the detailed analysis of Cash Flow statement. The academic part covered in the earlier three blogs is a must to read to understand this section better. In case you have not read, please check these below three blogs:
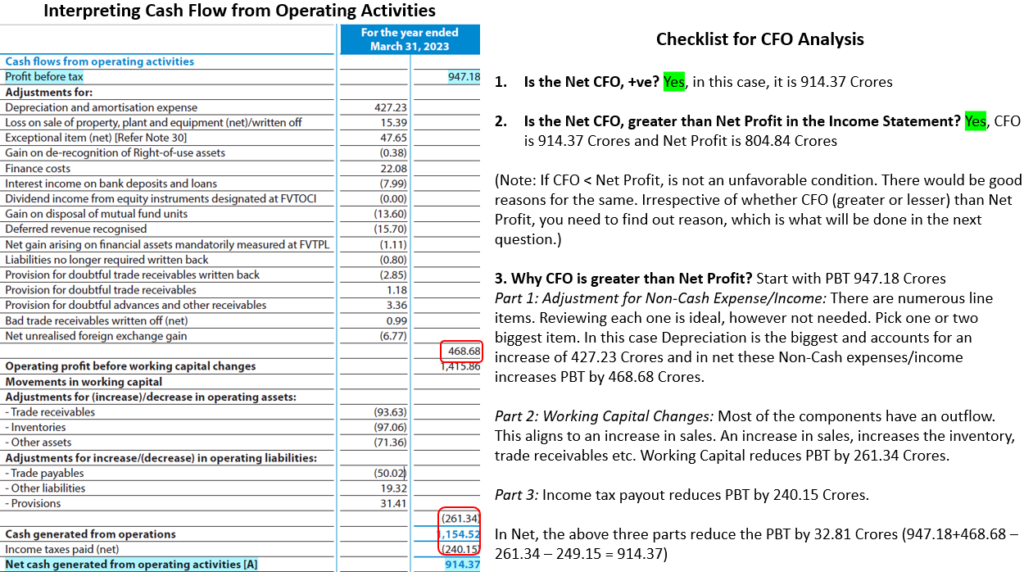
Interpreting Cash flow from Operating Activities
Interpreting Cash Flow from Investing Activities
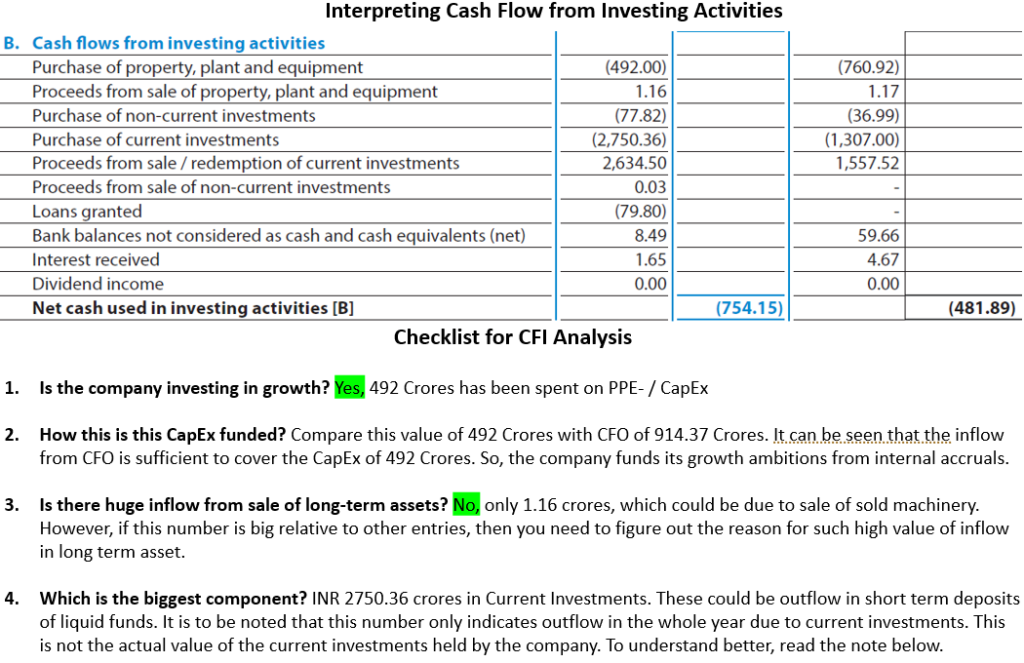
Consider this scenario: You have 5 lakhs set aside in liquid investments for your child’s college admission, which could happen anytime. Instead of letting the money sit idle, you invest it in short-term fixed deposits (<14 days), renewing the investment each time it matures until needed for college fees. Let’s assume the interest every 14 days is around 500 rupees. This 500 being small amount, I’ll overlook it for convenience in further discussion.
After 10 renewals, the total cash outflow for the deposit would be 50 lakhs (5 Lakhs x 10 times invested), despite only 5 lakhs being the actual investment amount. This analogy applies to the Current investment figures in the Cash Flow from Investing activities, representing the total outflow/inflow in current investments throughout the year. The actual value of the current investments is as shown in the Balance sheet.
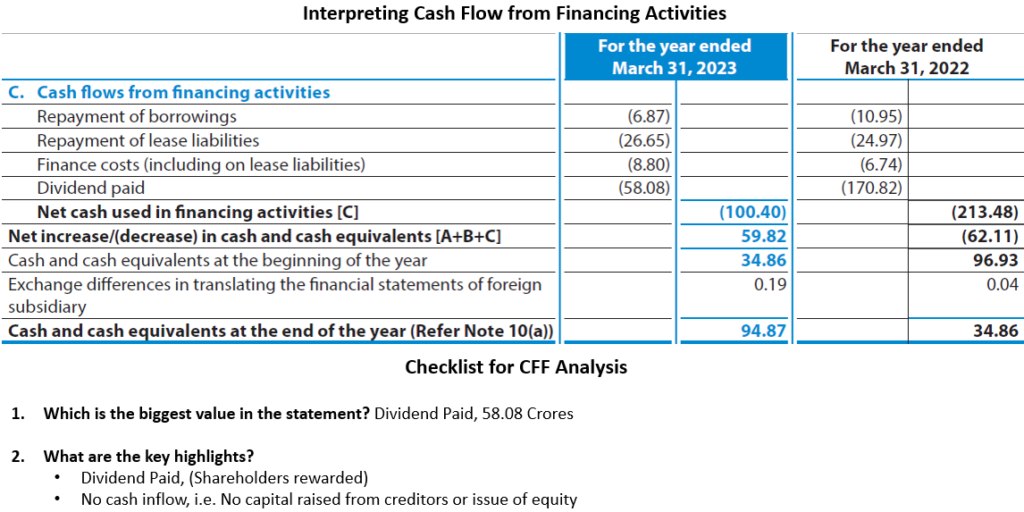
Interpreting Cash flow from Financing Activities
Sources-Uses Analysis
This approach was not covered in the previous blogs. It’s very simple and will be explained with an example.
Begin by examining the top 2-3 cash inflows and outflows in the cash flow statement. This sheds light on where the company obtains and allocates its cash, reflecting its strategic priorities. For instance, in this example,
- The largest inflow is from CFO (914.37 Crores),
- While the two most significant outflows are for CapEx (492 Crores) and Dividends (58.08 Crores) to shareholders.
This suggests that the company generates cash from operations, utilizes it for future growth investments, and rewards shareholders with dividends.
What is the Story?
This is the summary of the analysis that was done so far.
- CFO (914.37 Crores) is greater than reported Net Profits (804.84 Crores). An indication that the company can make real cash profits, higher than the reported Net Profit
- CFO (914.37 Crores) is greater than investment in PPE (492 Crores), thus funding growth internally without the need for borrowings.
- CFO (914.37 Crores) is sufficient to pay reward the shareholders through 58.08 Crore dividend payout. The company need not borrow to pay dividends.
- The balance from CFO (914.37 Crores) post outflow in CFI (754.15 Crores) and CFF (100.40 Crores) is around 59.82 Crores to be carried to the balance sheet.
- The company has not raised any new debt this year.
- Rewarded shareholders with 58.08 Crores of Dividend.
Trend Analysis
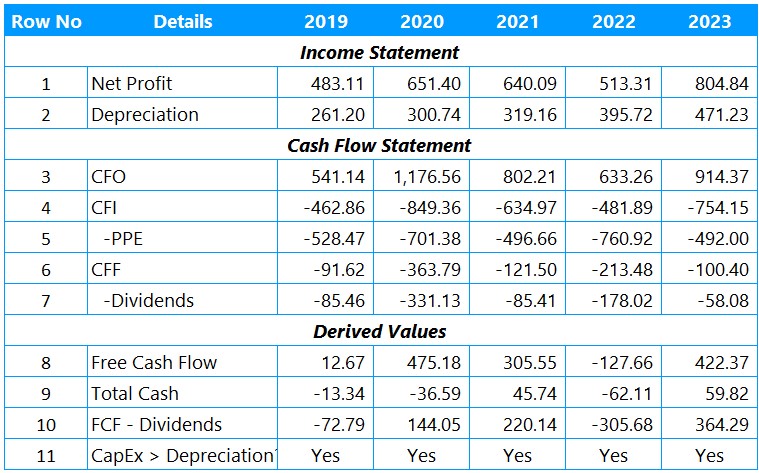
The Multiyear analysis of Cash flow statement throws more insights than a single year analysis. This analysis is best done in an excel file as in the sample below. I have picked up data from the past 5 years Annual report and tabulated below. I have picked only 5 years, since that is sufficient to illustrate the approach of multiyear analysis. This analysis is very idea if done for 10 years. The Row numbers above would help in explaining the analysis better. Row 1 to 7 are the values as picked from Financial Statements, whereas 8 to 11, are derived numbers using the values from Row 1 to 7.
Net Profit Vs CFO
Check the values in Row 1 and 3.
- In all the 5 years, the company’s cash profit is higher than the reported net profit, which is a positive sign of its operations.
- All these 5 years, the CFO is positive means that the company is able to translate sales to cash profits.
FCF
Examine the figures in Row 8. Over four years, there’s a positive FCF, with one exception. FCF represents the cash remaining after covering CapEx with Cash from Operations. A positive FCF signals operational and financial strength—imagine a company generating cash (CFO) from operations, investing it in CapEx (PPE) for growth, and still having cash on hand.
Dividends
In Row 7, it’s evident that the company has consistently paid dividends over the past five years, which is generally viewed as a positive indicator, despite some years having lower payouts.
However, assessing the quality of these dividends is crucial. One approach is to evaluate whether the dividends were funded by free cash flow (FCF). This can be done by comparing FCF with the dividend payments.
- If (FCF – Dividends) > 0, it indicates that the dividends were covered by FCF.
- Conversely, if this value is less than zero, any shortfall was likely covered by cash from current investments (listed under CFI) or by debt.
Notably, the company has not resorted to borrowing for dividend payments, as evidenced by the absence of debt raising (CFF) over this five-year period. Hence the shortfall in this case is covered by current investments.
Total Cash
Look at Row 9, where the total cash is the sum of CFO, CFI and CFF.
- A positive value means cash is added to the Balance sheet.
- A negative value means cash is withdrawn from the Balance sheet.
CapEx Analysis
Referring to Row 5, it’s evident that the company has consistently invested in CapEx over the past five years, indicating a commitment to growth and potential future profitability.
How to assess if the CapEx is low or high? One simple solution is compare the scale of CapEx with Depreciation (in Row 2)
- If CapEx exceeds depreciation, the company’s asset base is expanding.
- Conversely, if CapEx is less than depreciation, the asset base is shrinking.
Over these five years, the company’s asset base has consistently grown, with CapEx exceeding depreciation each year. This consistent trend underscores the company’s ongoing investment in its asset base to support future growth opportunities.
Conclusion
The cash flow statement offers a window into a company’s financial operations that complements the income statement and balance sheet. By delving into cash flows from operating activities, investing activities, and financing activities, investors can assess how a company generates and allocates its cash resources.
The real-world example showcased in this blog underscores the practical application of cash flow analysis, providing a roadmap for readers to navigate financial statements effectively and make informed investment decisions. Understanding the nuances of cash flow analysis is essential for anyone seeking to uncover the financial health and management strategy of a company.
This is not the end; the next part will continue with the same examples and demonstrate how to calculate and draw inferences from various cash flow ratios.
Hope you found this blog useful. Do share my blogs with your friends, peers and fellow investors.
Excellent reference for understanding cash flow statement. Thanks a lot for educating us.
You are welcome Shankar Ganesh. If you find this useful, do spread the word about my Blog in any “Investor WA Groups” you are part of… or in your Twitter handle. Wider reach definitely motivates me to write more. Thanks Venkatesh.